
About this Report
Open data—the idea that information should be both electronically-standardized and freely-available—has taken hold in the U.S. government and American society. Starting with the release of the Sebastopol principles in 2007,1 public-sector leaders, civil-society advocates, and the technology industry have worked together to liberate information from outdated document-based storage and siloed systems by applying the two basic steps of open data: first, standardization and, second, broader sharing.
The Data Foundation, founded in 2016, seeks to define an open future for our government’s and society’s data through research, education, and programming. To enhance policymakers’ and the public’s understanding of open data’s history, present status, and prospects, the Foundation publishes this annual report, State of the Union of Open Data. The report is based on a survey of the leaders of the open data movement in government, in the private sector, and at the intersection of both. Each year, interviewees are selected from the speaker lineup of Data Transparency, the nation’s largest annual open data conference, which is hosted by the Data Foundation.
This third edition, co-produced and co-published with Grant Thornton Public Sector, draws on 33 interviews with federal, state, and international government officials and private-sector thought leaders, all of whom participated as presenters at Data Transparency 2018.2 A standardized survey instrument was used to draw a set of common responses, with some survey questions repeated from the previous year to illuminate changes. Interviewees were also encouraged to provide context and additional observations to enrich the standardized responses.
Authors
Jim Harper, Independent Consultant
Adam Hughes, Grant Thornton Public Sector
Contents
Introduction
Where is open data on the technology adoption curve? It is definitely progressing, but is it in the thick part of the curve yet? Or just reaching the early adopter stage?
The idea of gauging technology adoption didn’t originate with electronics and digitization. Indeed, it was as early as 1957 in the field of agriculture that people’s adoption of technology was studied and articulated. Iowa State College’s Agricultural Extension Service published a paper characterizing how “farm people” embrace new ideas and techniques. They first enter an interest stage, then they go through an evaluation stage, then trial, and finally adoption.3
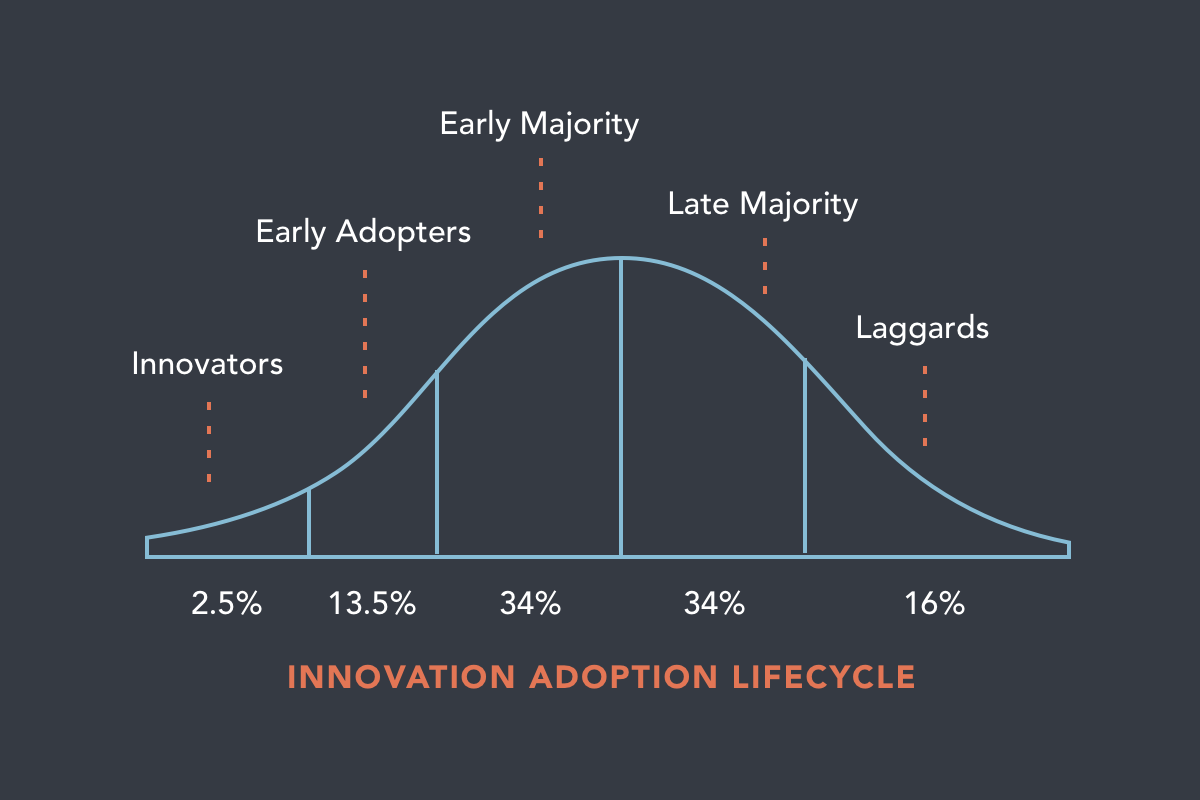
Today, the technology adoption curve is often depicted as a classic bell curve describing types of people. That version of the curve divides technology users among: innovators, early adopters, “early majority” users, “late majority” users, and finally laggards.4
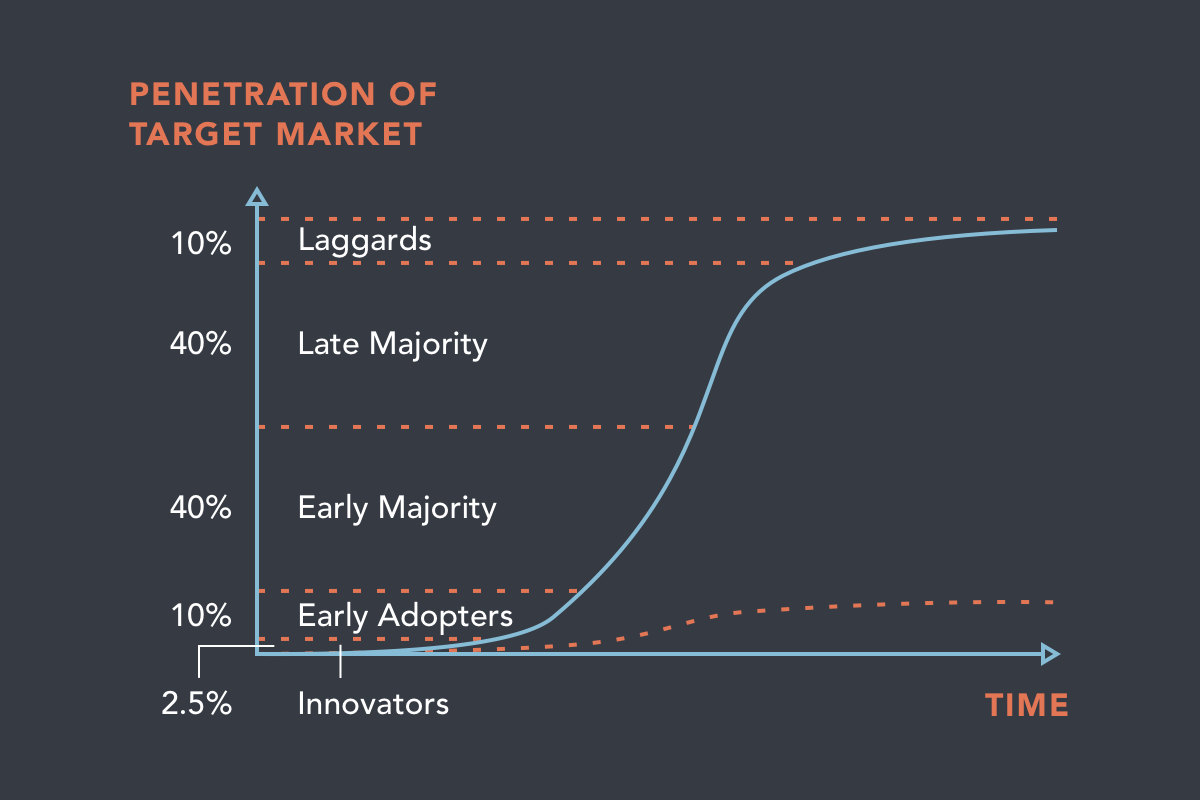
Another visualization of technology adoption plots market penetration over time. An “S” curve shows how adoption and use increase slowly at first, how they speed up through the middle of the adoption cycle, then slow down again as the last hold-outs join up with now-inevitable technology trends.5 This “market penetration” view allows interesting comparisons among the adoption rates for various technologies and devices.
Open data is not a single technology or product, of course, so its adoption can’t be tracked quite like radio or color television, the Internet, cell phones, or cryptocurrency. But the organizational users and the technologies that comprise open data should follow the same general path of technology adoption—slow at first, then speeding up as more and more organizations adopt open data technologies and practices.
Where is open data on the adoption curve? There is no way to pinpoint it precisely. But the interviews making up this edition of the State of the Union of Open Data suggest strongly that open data is moving forward and upward on the curve. Government agencies and private entities are increasingly adopting open data in all its dimensions, and even where adoption has not taken hold, the inevitability of open data is clear. Interest and evaluation will soon lead to trials and experimentation, and then full-blown use.
This year, the third edition of the Data Foundation’s State of the Union of Open Data surveyed leaders in the open data world about the state of play in terms of data standardization; publication and sharing; and, finally, use—the all-important role of open data in supporting decisions and gleaning insights that would otherwise not be available.
Almost uniformly—and more than in past years of our survey—the experts we surveyed saw forward progress.6 That progress is either manifested in real, specific examples, or it is anticipated because our respondents see that more and more people recognize the importance of open data. Almost without exception, open data leaders expect continued advances in open data in the near future. Interviewees’ optimism matched policymakers’ enthusiasm: on January 14, 2019, as this report was being finalized, the President signed into law the OPEN Government Data Act,7 establishing a government-wide presumption that all federal information should be expressed as open data.
As before, the survey examined the importance to open data leaders of the benefits of open data in three areas: external transparency, internal management, and automated reporting. As seen last year, there is an increasing emphasis on using open data for internal management, even though the birth of the open data movement was oriented toward external transparency. Automated reporting and transparency roughly tie in importance behind management.
And the field of open data is expanding. From its natural origin in subject matter such as financial management and auditing, open data will more and more find uses in managing programs, tracking results, and providing transformative visions of what’s possible. Open data will open new vistas. But they depend on standardizing data, publishing it, and putting it into use.
The Process of Open Data: Progress on Standardization, Sharing, and Use
The Data Foundation defines “open data” in terms of two steps: first, standardize data in open formats and, second, publish or share the data. Once you have open data thanks to the first two steps, the cycle is completed when the data is used to make decisions, gather insights, and more. Data Transparency 2018, the Data Foundation’s annual conference, on whose program this survey is based, reflected these three basic activities with its three-part theme: “Standardize. Share. Use.”
In this study we first asked our respondents whether the two basic steps of open data data—standardization and publication—had improved over the past year. The answer to both questions was, overwhelmingly, yes. Along with concrete examples of improvements in standardization and sharing, progress was expressed in terms of interest, attention, and ongoing projects. The improved open data environment is both a present reality and something our interviewees highly anticipate in light of current events and trends.
Next, to reflect the imperative that the government and the private sector utilize open data once it exists, we also asked about data use. We wanted to see if use of data for decisions and insights matched the effort and resources invested in standardization and sharing. To our delight, we learned that data use has seen even more recent growth than standardization and sharing, according to our interviewees. The development of visualizations, dashboards, and other tools, allowing people without backgrounds in data science to access the value of open data, is bringing open data into the mainstream, and to the masses.
In each of these three areas—standardization, sharing, and use —the nation’s open data leaders report significant progress.
Standardization
In your field, has the standardization of data improved in the last year?
Reported progress on data standardization was already impressive at the time of last year’s report. In State of the Union of Open Data, Second Edition,8 81.8% of respondents reported progress in the last year, with 18.2% sounding more pessimistic notes. This year, the number reporting progress with standardization slightly increased to 83.9%, versus 16.1% in the negative.
A good number of respondents moderated their affirmative responses with qualifying language, saying, for example, that there is still much work to be done. Some said progress is slight, or that there remains a giant uphill battle to bring disparate data elements in disparate organizations into standards frameworks. Some noted certain types of data, such as financial data, are ahead of other areas, such as programmatic data and results.
Others cited specific examples of data standards that have been finalized or are in the latter stages of finalization. Progress globally with the XBRL standard—both its adoption and refinement—is an example respondents cited (see “A Year of Progress in Financial Reporting Data Standards” below). XBRL, or eXtensible Business Reporting Language, is a standard for financial reporting .

A Year of Progress in Financial
Reporting Data Standards
by Hudson Hollister, Founder and Member of the Board of Directors, Data Foundation
European Union Moves Toward XBRL for All Corporate Financial Statements. At the end of 2017, the European Securities Markets Authority (ESMA) formally adopted a new electronic structure for the reports filed by all companies issuing securities listed on European markets.9 This new electronic structure imposes the XBRL standard on all financial statements included within those reports. The new electronic structure must be used starting on January 1, 2020. According to ESMA, XBRL will “facilitate software supported analysis and comparison of different reports, granting investors a key tool to support their investment decisions.”10 Throughout 2018, ESMA worked with national securities regulators, securities markets, and public companies to prepare them for the mandate.
Florida Adopts XBRL for Local Government Financial Statements. On March 23, 2018, Florida became the first state to set a requirement for its local governments to produce financial information as standardized data, rather than just as plain-text documents, when Governor Rick Scott signed H.B. 1073.11 The new law directs the state’s Chief Financial Officer to create a system for collecting local governments’ financial information using the XBRL standard and requires municipalities and special districts to begin reporting their financial information that way.
According to municipal transparency advocate Marc Joffe, “If other states follow and the federal government takes notice, we could finally have a comprehensive database of government financial statistics. Such a database could give us early warnings of fiscal insolvency while improving information flow and lowering costs in the municipal bond market.”12 On December 5, 2018, the Data Foundation and Workiva published a research paper explaining the benefits of open data for the financial information reported by both state and local government entities and laying out the crucial steps of building a national infrastructure to report and exchange such information in XBRL.13
SEC Adopts iXBRL for Corporate Financial Statements. On June 28, 2018, the Securities and Exchange Commission (SEC) adopted the inline XBRL, or iXBRL, standard for financial information filed by public companies and mutual funds.14 For nearly a decade, the SEC had collected two separate versions of most financial statements--one in the XBRL standard and another as plain-text. This duplication prevented public companies, markets, and the SEC itself from realizing the benefits of open data, because most users continued to focus on the plain-text version of each financial statement. Advocates for open data had, for many years, called on the SEC15 to replace the duplicative system with a single submission, using iXBRL, which is both human- and machine-readable. The SEC’s decision to do so opens the door for higher- quality financial information and more extensive use of the resulting data sets by companies, markets, and the agency.
Congress Mandates Standards Everywhere. On January 14, 2019, the President signed into law the OPEN Government Data Act,16 which establishes a sweeping, government-wide presumption in favor of the use of machine-readable data formats for all information maintained by executive branch agencies. Although the OPEN Government Data Act does not specifically mention XBRL, its mandate favors the adoption of XBRL for financial information, since XBRL is the only widely- accepted data standard for financial reports.
Others cited the adoption of LEI, or the Legal Entity Identifier. Hewing to a single standard for identifying corporations and other entities has lifted a huge amount of administrative overhead from organizations now using the LEI.17
Much of the reported progress is bound together with what is anticipated. Respondents noted the growing awareness of data standardization, and the education and discovery processes underway in many organizations. Some cited federal legislation that is expected to drive standardization efforts, the White House’s Federal Data Strategy, which emphasizes standardization (see “A Year of Progress in Financial Reporting Data Standards” above), and state-level open-data mandates. Each are expected to drive forward standardization processes in their realms.
An interesting form of progress that respondents cited is in the variety of tools and techniques to bring together and match data sets even when the data sets do not follow the same standards. Even when formal standardization has not occurred, and the official versions of data sets are not interoperable, data professionals are using technology to create purpose-built work- arounds.
“Even when data sets aren’t formally standardized, it’s becoming easier and easier to convert data from it’s original format into something you can use. You don’t have to be a PhD techie to work with data any more!”

Federal Data Strategy Brings Executive Energy to Data Standardization
by Christian Hoehner, Senior Policy Director, Data Coalition
In February 2018, the White House released the President’s Management Agenda,18 a comprehensive statement of the Administration’s approach to modernizing the federal government. Central to the President’s Management Agenda is a three-part approach: modernization in information technology; data, accountability, and transparency; and the federal workforce.19 The release of the President’s Management Agenda marked the federal government’s clearest recognition of the need to separate information technology systems from the data that they generate and use. In the President’s Management Agenda, the White House announced fourteen key projects, including the creation of a Federal Data Strategy.20
Throughout 2018, the White House worked with agencies, the technology and data industries, and civil-society advocates to create the Federal Data Strategy, and released it in October 2018.21 The Strategy consists of principles, practices, and use cases. Together, these elements indicate a strong commitment toward data standards:
• Among the Principles are a commitment to “Conscious Design,” which means that data resources’ quality and integrity are protected and that data resources are reused where possible, including through planned interoperability.22
• Among the Practices are a mandate to govern data as a strategic asset and use it efficiently, requiring agencies to “Periodically review and optimize the use, adoption, and creation of data standards within relevant communities of interest to identify opportunities to maximize federal data use, access, sharing, and interoperability.”23
• The White House highlighted specific data standards, including XBRL for financial information and the LEI for entity identification, as Use Cases.24
Speaking at Data Transparency 2018, White House Office of Management and Budget deputy director Margaret Weichert25 and United States Chief Information Officer Suzette Kent26 both touted the Federal Data Strategy as an effort to get more value out of information already collected and maintained by the government. The White House’s support for data provides energy for standardization across the federal government’s vast information portfolio.27
“The open-data movement is big and growing. I see data sharing on the increase in science, smart cities, and countless other areas.”
Sharing
In your field, has the sharing of data improved in the last year?
The increase in our respondents’ optimism about data publication, or sharing, was even greater than the increase in standardization. In our 2017 report, 76.2% of respondents reported improvement in the past year, as compared to 23.8% finding none. In a dramatic jump, this year’s study finds that 84.8% report progress. Only 15.2% do not.
As with standardization, respondents caveated their answers and cited ways data sharing could improve. There is more talk than action, according to some. A few respondents noted the propensity of some agencies to treat data as proprietary, or to withhold or limit data sharing as a way of protecting their “turf.”

Closed Company Data: The Illinois Problem
by Chris Taggart, Founder and CEO, OpenCorporates
Company register data, maintained by official registrars such as U.S. secretaries of state, is such an important dataset that it’s often taken for granted. Yet it is the basis on which all business is done—the companies that are incorporated in a jurisdiction, that we work for, buy from, sell to, and regulate.
Without easy access to company register data, you just don’t know who you’re doing business with. If you want to understand government procurement, you need to tie the contract database to the company database. The same goes for licenses, citations, real-estate ownership, and political donations by companies.
That’s why over the past five years a succession of U.S. states have made their company registers available as open data, allowing it to be used as widely as possible to facilitate a transparent and trusted business environment. Restricting access to this database not only adds opacity and friction to business, it also creates a benign environment for crime and corruption.
Yet one U.S. state stands out against this trend: Illinois. Not only does Illinois not publish any open data on companies, it goes out of its way to prevent the data being accessed: the corporations data is excluded from the state Freedom of Information Act; web-scraping of the corporation register is prohibited by criminal statute; and not only does Illinois charge a hefty fee for buying the data, the state prohibits making it freely available if you do buy it.
This is a real shame, and in the end it only damages Illinois—not just in reputation, but in opacity, which increases the risk of doing business with Illinois companies. Because of state policies, data about Illinois companies is lacking the scrutiny that wide exposure brings.
For some, confidentiality claims stand in the way of data sharing. Others noted there are insufficient resources in certain jurisdictions to drive forward data-sharing policies.
But data sharing is taking hold. Internationally, there is no better example than Australia, whose government’s assistant secretary for data and digital, Andrew Lalor, keynoted Data Transparency 2018.28 There, two specific data sharing projects illustrate the state of the art. Australia’s data.gov.au provides an easy way to find, access, and reuse the government’s public datasets. It provides a central catalogue where people can discover public data, and it hosts tabular, spatial, and relational data with APIs. Agencies can provide links to data and services hosted by other government sources.
Australia’s NationalMap, at nationalmap.gov.au, facilitates sharing by providing easy access to spatial data from Australian government agencies. That data is open to government, business, and the public to use as they will in service to the public, for growing the economy, and in commercial and community innovation.
Our interviewees also provided unfortunate counter-examples, such as the State of Illinois’ failure to share corporate registration data, to the detriment of public transparency and its own companies’ ability to attract investment (see “Closed Company Data: The Illinois Problem” above).
Use
A new line of inquiry in this year’s State of the Union of Open Data study is data use. The goals of open data are reached when it helps inform decisions and produce new insights, or when substituting open data in the place of old-fashioned, document-based reports allows processes to be automated. So this indicator is an important one. Without use, the two classic steps of standardization and publication are not worthwhile.
“One shouldn’t justify opening data only on the ‘pull’ from known data users with predictable use cases. New users and uses are waiting to be found.”
We were delighted to find that our respondents report progress on data use at an even higher rate than standardization and sharing. A whopping 96.9% say data use has improved over the last year, with 3.1% reporting no change.
One might expect use to increase more dramatically. Use must follow standardization and sharing, so it would have a lower baseline. But the results still bode very well for open data.
In your field, has the use of data improved in the last year?
The story in the “use” area is of various tools and technologies that allow non-data scientists to exploit open data and realize the benefits of transparency, management, and automation described below. Visualizations, dashboards, analytical tools, and fraud detection tools were all cited by respondents as examples of data use technologies.
Some respondents noted how the federal Digital Accountability and Transparency (DATA Act) of 2014, which required all agencies to standardize and publish their spending information as open data, had spurred and encouraged spending data use by creating a reliable pipeline. Others pointed to a similar phenomenon stemming from Ohio’s 2014 decision to publish standardized spending data (see “Creating a Pipeline for Federal Spending Data” and “Creating a Pipeline for State Spending Data” below). That perspective suggests simply opening data—i.e., providing supply—creates users and uses (demand). One shouldn’t justify opening data only on the “pull” from known data users with predictable use cases. New users and uses are waiting to be found.

Creating a Pipeline for Federal Spending Data
by Hudson Hollister, Founder and Member of the Board of Directors, Data Foundation
At Data Transparency 2018, two Treasury Department executives, Fiscal Assistant Secretary Dave Lebryk and Deputy Assistant Secretary Amy Edwards, presented the results of the federal government’s four-year-old mandate for open data in spending.29 By applying a single data standard across formerly disparate reports on every federal agency’s accounts, budget actions, and awards, as was mandated by the DATA Act of 2014, Treasury has created a unified data set that depicts the finances of the entire federal government as a whole.
Treasury publishes that data set at USASpending.gov, which provides extensive search capabilities to the public and also offers the data set for free bulk download.30 In addition, Edwards demonstrated cutting-edge analytical projects on Treasury’s Data Lab platform.31 Treasury hopes the projects highlighted on the Data Lab can inspire users inside and outside the federal government to create their own.
Judging from the observations of our State of the Union of Open Data interviewees, this is happening. Federal agencies are beginning to use easily-accessible open data from USASpending.gov to procure their own spending data for their business processes, rather than re-creating that data by separately querying internal systems—systems that typically are outdated and difficult to pull insightful data from. And vendors customizing insights drawn from federal spending open data are proliferating.
Creating a Pipeline for State Spending Data
by Frank Kohstall, Director of Public Affairs, Ohio State Treasurer
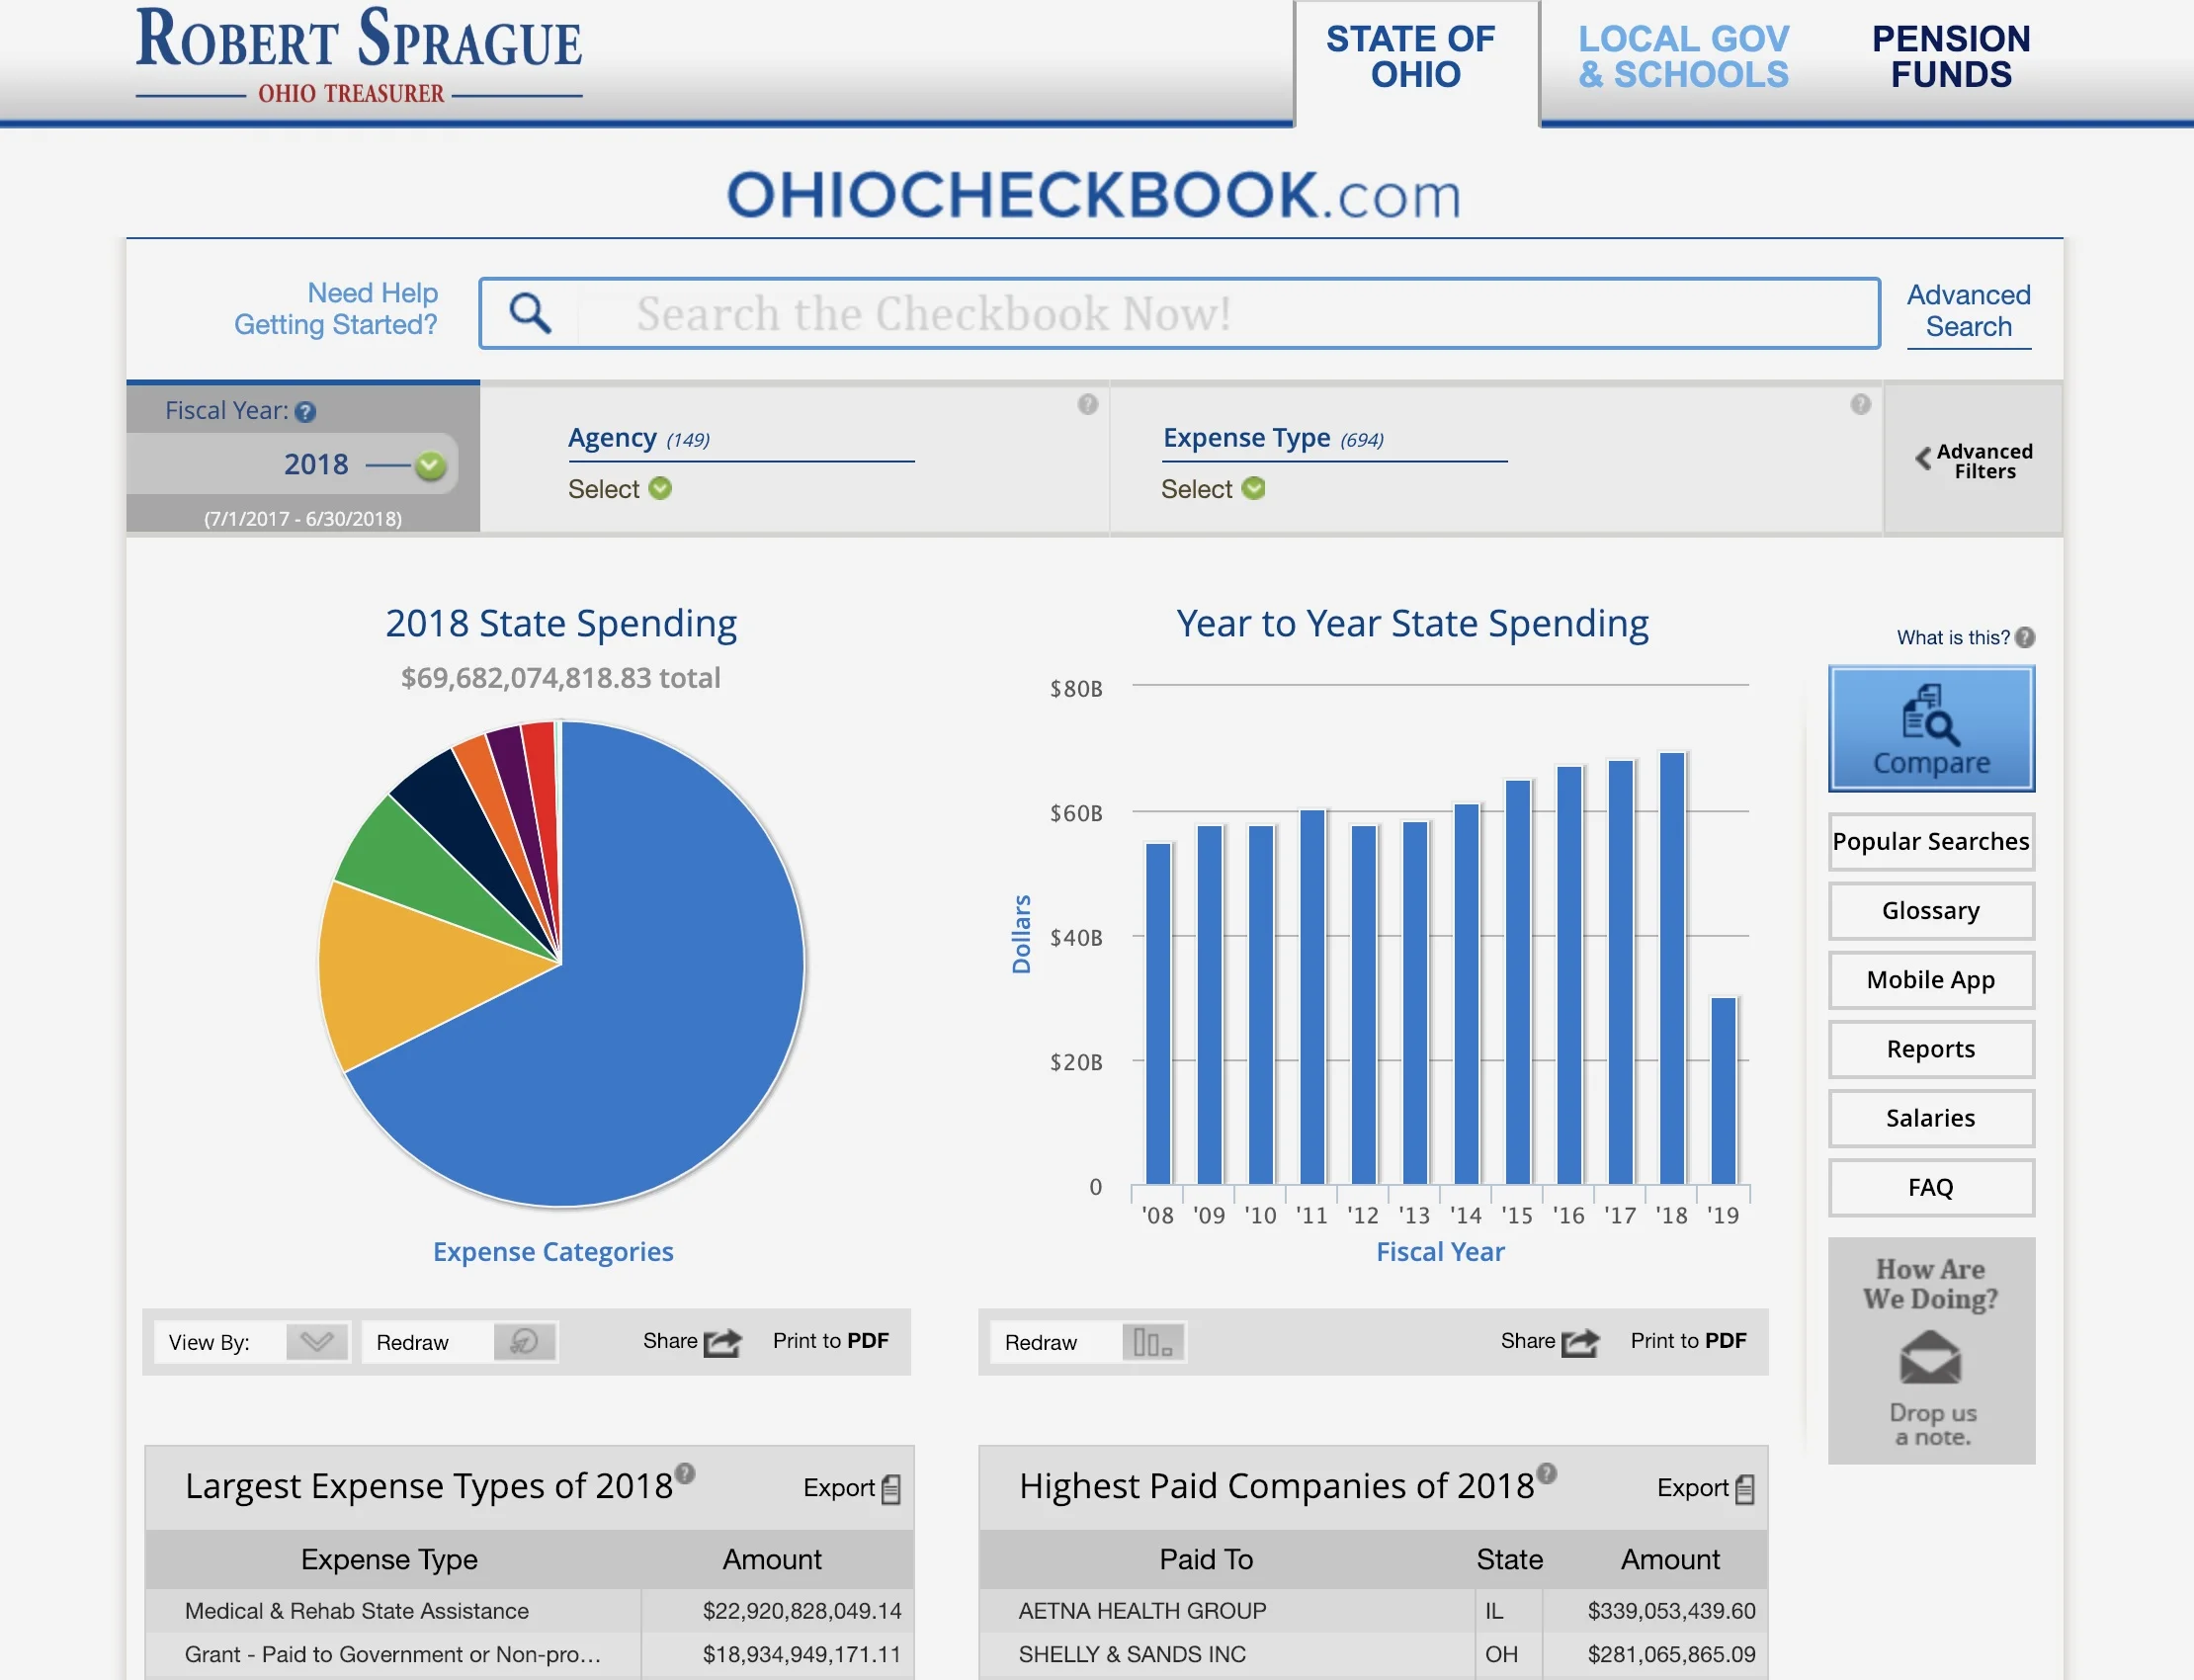
OhioCheckbook.com is a wonderful example of open data in use. Launched on December 2, 2014, it marked the first time in Ohio history when citizens could actually see every expenditure in state government. As of November 12, 2018 there have been more than 1,030,000 total searches on the site.
OhioCheckbook.com displays more than $690 billion in spending over the past eleven years, including more than 186 million transactions. The website includes user-friendly features such as:
• “Google-style” contextual search capabilities, to allow users to sort by keyword, department, category or vendor;
• Fully dynamic interactive charts to drill down on state spending;
• Functionality to compare state spending year-over-year or among agencies; and,
• Capability to share charts or checks with social media networks, and contact information for agency fiscal offices.
In March 2015, the U.S. Public Interest Research Group (U.S. PIRG) released their annual “Following the Money 2015” report, giving Ohio under the number one transparency ranking in the country.32 The state climbed from 46th to 1st in spending transparency as a result of Treasurer Josh Mandel’s release of OhioCheckbook.com.
In April 2018, U.S. PIRG awarded Ohio the number one ranking in the country for government transparency for the third consecutive year.33 The organization cited Ohio’s addition of local governments, pension funds, and public universities to OhioCheckbook.com as a primary reason for the high ranking, and it praised Ohio for setting the national standard for state spending transparency.
As with other fields, respondents are not all entirely satisfied. Some described progress as small, or “not where it needs to be,” but this will be the case for a very long time given the vast capabilities for open data properly and fully used.
Do you anticipate the standardization, sharing, and use of data related to your field to improve or deteriorate in the next year?
As standardization, sharing, and use of open data demonstrate identifiable results across both the government sector and in private enterprise, the benefits of open data will be even clearer and the demand for open data will increase even more. More standardization, more sharing, and more use will produce a virtuous cycle. And the benefits of open data will flow ever faster.
A wide majority of respondents to the State of the Union of Open Data survey believe standardization, sharing, and open data use will improve in the immediate future. Optimism accounts for 93.6% of the responses, while 6.4% see regression or an equivocal near future for open data. These responses marked a notable improvement over last year’s survey, in which 79.2% of respondents predicted improvement.
As with the other questions in this area, many positive responses came with caveats and conditions suggesting progress will not be automatic. It will require continued effort to reap the various benefits of open data.
The Benefits of Open Data: Transparency, Management, and Automation
In 2017 and again in the 2018 study, we asked State of the Union of Open Data respondents to rank the importance of three categories of open-data benefits: transparency, management, and automated reporting. The trend noted in 2017 continues: respondents identify internal management as a key, and, for now, the leading, benefit of open data.
Internal management is a lot of different things to different people and organizations. But it includes financial management, budgeting, and auditing; allocating and tracking resources and personnel; finding and addressing anomalies; and other essential parts of making organizations run. It includes efficiencies brought to functions such as fraud detection. Open data allows more eyes to get a view of what is happening in an organization, it allows tools to be designed that vastly enhance individuals’ productivity, more and better integration of effort, and less loss and waste of financial resources, material, and employee time. Using a weighted score,34 internal management rises about 30% above transparency and automated reporting, which are roughly equal in the estimation of our respondents.
As many respondents noted, there are close affinities between these categorical benefits of open data. Automated reporting, for example, is easily made a tool of both management and transparency. In grant reporting, for example, automated reporting will reduce administrative time and effort at the grant-making organization. Clean, automatically-reported data can be fed directly into management systems, allowing grant program leaders to administer those programs more efficiently. Meanwhile, automatically-reported data can readily be turned around for public perusal, improving transparency and with it public confidence in the grant-maker, grant recipients, and the grant program overall.
Likewise, data released for transparency purposes by one organization may be used to improve the management of another. Weather data, for example—one of the paradigmatic open data sets—allows entities and individuals around the nation and world to better tailor their logistics. Everything from long-haul trucking to agricultural processes35 to weekend vacation planning benefits from the free access given to data about what it is probably going to be like outside.
It may, of course, be a bias in the survey that our managerial respondents prioritize internal management over other benefits. There is no reason to discount transparency or automation.
Transparency has been the political impetus for some of the most important advances in open data. Given promises made on the campaign trail, within minutes of President Barack Obama taking office on January 20, 2009, the Whitehouse.gov website declared: “President Obama has committed to making his administration the most open and transparent in history.”36 His first presidential memorandum, issued the next day, was entitled “Transparency and Open Government.” It declared:
My Administration is committed to creating an unprecedented level of openness in Government. We will work together to ensure the public trust and establish a system of transparency, public participation, and collaboration. Openness will strengthen our democracy and promote efficiency and effectiveness in Government.37
As President Obama’s early missives made clear, the broad value of transparency to democratic government would also serve management ends. Both the Federal Funding Accountability and Transparency Act (FFATA)38 and the DATA Act39 were transparency laws aimed at assuring the public and building public confidence in the federal government, with substantial management benefits resulting from their passage.
Automation similarly offers vast benefits. With automation in the collection of data, the federal government can improve accountability to the public and investors; facilitate data-driven analysis and decision-making by agencies; and reduce compliance costs. Automated reporting is just the leading edge of a world of possibility, including automated regulatory compliance based on technical standards for comprehending legal requirements.40
The next step beyond automation is to apply predictive models to improve decisions and reduce costs even further. For instance, a predictive model can identify contracting transactions or citizen interactions that differ from the norm, in real time. Agencies can use predictive models to stop fraud or connect with citizens’ needs immediately, rather than after a time-consuming manual review. But predictive models cannot be applied unless the underlying transactions or interactions are automated in the first place. And, in turn, automation cannot happen, at scale, without data standardization and data sharing.
The three categories of benefit assessed by the State of the Union of Open Data survey are very broad, and they capture nearly all of the good that can come from open data, but there are still other benefits. For example, open data can produce entire new markets. A wonderful array of businesses and services has been built atop open GPS data.
In addition, open data can be a way for agencies to communicate priorities and reach audiences in the private sector. For example, the Education Department’s College Scorecard, which publishes open data on completion, debt, and post-college earnings for undergraduate institutions, is not intended only to improve the transparency of these institutions’ performance. When first published in 2013, it also expressed a policy priority:
[T]axpayers can’t keep on subsidizing higher and higher and higher costs for higher education. Colleges must do their part to keep costs down, and it’s our job to make sure that they do.41
“Publishing data on a website reaches a certain audience, but opening up data allows exponentially more users to use that data in varied ways. When the federal government acts as a wholesale data provider rather than a retail technology provider, that saves taxpayers money and gives them more choices.”
When an agency has information that it wants to make accessible to the public, an open data feed allows non-governmental entities to build applications, web sites, and information services that distribute the data in many different ways. There is no one right way to present data. Open data feeds allow for the discovery of many different paths for distributing information. New analytical tools can be built for open data by any comer.
“Open data produces feedback loops that drive data quality. If data publishers don’t correct errors reported by users, they stand to be embarressed!”
Finally, open data has wonderful recursive benefits. The users of open data provide feedback to data producers. Users will push for sound data definitions, for example, and they naturally do quality control on data as they work with it. Their communications back to data producers drive improvements in data quality, which benefits the data producers and all other users. These benefits are not available to closed data systems.42
Open data certainly helps managers achieve their goals and run their organizations well. It also enhances transparency, which is a means to many ends, including building confidence, enhancing democratic processes, and rooting out waste and fraud. Open data is driving cost-efficient compliance in the worlds of grant-making, public company oversight, and beyond. But there is much more to explore in the big and growing world of open data.
The Future of Open Data: From Nuts and Bolts to Results and Vision
The respondents to the State of the Union of Open Data survey were nothing if not voluble and imaginative about the variety of topics yet to cover and the many angles from which to explore open data. The many and varied subjects and dimensions of the open data future, according to the leaders we interviewed, include:
Science Data
There is a strong and growing open data movement in science. The state of the art in science is changing from releasing study reports to releasing reports along with the full data sets that underlie them. When data is available without what have been called “price” or “permission” barriers,43 this allows other researchers the fullest opportunity to validate, explore, and extend the science. The U.S. national labs are engaged and should be more engaged in the movement toward open scientific data.
Legal and Compliance Issues with Opening Government Data
Once data is open and freely available to all, legal and compliance issues around use fall away. But getting from closed systems to open involves a lot of hurdles. Some data managers have overcome them, and they have lessons to share with those coming behind them.
Along with the cultural and normative shifts required of agencies as they move toward open data sharing, there are important issues to tackle, including copyright, privacy and confidentiality, trade secret, and so on. Agencies may have internal rules or practices that hamper data sharing.
The Australian Productivity Commission produced a report assessing factors holding back data-sharing. The factors include a "dense web of legislative requirements" and a culture of risk aversion, which lead to overly cautious interpretation of legislative authorities.44 Those issues and many others should be explored and assessed so the most can be made of data that should rightly be in the public domain and readily available.
GIS
Location data is uniquely powerful, and governments act with particular reference to physical locations (their jurisdictions). Some of the largest and most important problems and challenges are best understood spatially.
Geographic information systems have a wide array of powerful uses, from city and land use planning to disaster relief and recovery, transportation, logistics, crime control, tracking power consumption, human geography, and so on. This means there is a tremendous amount of potential in GIS.
The Chief Data Officer Role
Data management is an emerging specialty that arguably lacks the support it could use from colleges and business schools, for example. One exception is the Institute for Chief Data Officers (iCDO) at the University of Arkansas at Little Rock. iCDO’s founder and executive director, Dr. Richard Wang, was a participant in Data Transparency 2018.
“The Chief Data Officer role facilitates data-sharing and transparency, promotes data-driven decision-making, and at the same time protects data confidentiality and privacy.”
Data Transparency 2018 included the first-ever roundtable of State CDOs.
Governments and businesses are recognizing that data and information are important and valuable strategic assets. Put to full use, data can enhance the functions and successes of the organization, so the data manager has a crucial role in maximizing the value of this strategic asset. The role of Chief Data Officer (CDO) is increasingly important in both public- and private-sector organizations.
On January 14, 2019, the President signed into law the Foundations for Evidence-Based Policymaking Act, setting government-wide goals and requirements for incorporating evidence into policymaking. Embedded within this bill, as Title II, is the OPEN Government Data Act, which requires each agency to appoint a Chief Data Officer and sets a presumption that all public information should be standardized and published as open data.45
So that all organizations can better handle the significant assets they have in their data, articulate work should be done to advance the state of the art in data management and to train a cadre of people to fulfill the data manager, or CDO, role. Data Transparency 2018 featured the first-ever in-person roundtable of state CDOs, and equivalent and comparable officers of other titles, with participation by eight state government leaders.
Vertical, or Sectoral, Data
Data challenges exist in every agency, including contracts, spending, grants management, and so on. Exploring the commonalities is informative, and it is a horizontal view of open data issues.
But another way to look at open data is in a vertical or sectoral perspective. In fields such as health care, housing, education, and defense, the open data issues and challenges could be addressed top-to-bottom. What data expresses the ground truth about conditions in society? Data about governmental and private efforts to change things for the better is relevant. Performance and outcome data come into the mix, which should change the data about ground truth.
It’s a different way of examining open data that can produce interesting, intensive, and highly relevant—even newsworthy— discussion and debate.
Performance, Outcomes, Results, and Social Benefit
Open data about the “nuts and bolts” of government programs is relatively well-known and well-understood. Funds flows—the green eye-shade stuff—lend themselves very well to digitization and to treatment as open data. But there is more to open data than that. Performance of government programs and the outcomes they produce are a frontier on the near horizon.
The cycle of budgeting, appropriating, and spending is completed with data about performance, outcomes, and results. That data can then feed back into budgeting, bringing a complete picture of agency activities to managers, oversight bodies, beneficiaries, and the public at large.
But there is a vision for open data that makes completing that cycle in open data seem a little mechanistic and bland. More and fuller data sets tell stories. They bring to life new dimensions and expose more of what is possible. Not just results, but new possibilities can emerge when sufficient sets of open data are available.
“Open data allows for a ‘whole society’ view of programs, advancing the discovery, analysis, and utilization of data across sectors. Transportation systems are fast becoming information systems. Open data reveals that they are integrally woven into our social fabric and economic vitality.”
Conclusion
Open data is not a single technology but a large number of practices and processes. Together, they have potentially vast and kaleidoscopic effects. For this reason, it may never be possible to locate open data at any one point on the technology adoption curve. But the responses to our survey of experts on the State of the Union of Open Data show that open data is making great strides. And they anticipate even more.
Again this year, our experts report greater progress on standardization and sharing. They also extol the many and increasing uses of open data in both the public and private sector. Progress on all these fronts means interest and activity around open data will continue to blossom.
The great strength of open data for management of organizations and programs is reflected in the responses to the State of the Union of Open Data survey. Respondents rank management about 30% higher than transparency and automation. But those benefits should not be counted out— they are many and impactful. And there are other benefits, such as the creation of new markets and improvements in data quality that occur when data is exposed to a community of users.
The topics in open data we are familiar with are just the tip of an iceberg. There are many more subjects to explore and a variety of ways to examine open data issues. Along with interesting inquiries into open science data and geographic information systems, for example, there are institutional matters, such as the legal and practical hurdles to opening up data, and the increasing role of the data manager or CDO. New insights may be gleaned by examining how open data is in play in the many different sectors of society and government, including health care, housing, education, and national defense.
And while we complete the job of opening the “nuts and bolts” data into the open-data world, new frontiers come into view, such as data about programs’ results and outcome. Ultimately, as more and more data sets open up, the data can tell stories and reveal insights that few imagine today. More so tomorrow, but already today, the State of the Union of Open Data is strong.
Appendix: List of Interviewees
Srinivas Bangarbale, CDO, Commodity Futures Trading Commission
Nick Benes, CDO, Office of Naval Research, U.S. Navy
Andrea Brandon, Deputy Assistant Secretary, Department of Health and Human Services
Brandon Brown, CDO, Wage and Hour Division, Department of Labor
Barb Cohn, CDO, Colorado Department of Transportation
Michael Dalton, Research Economist, Office of Employment and Unemployment Statistics, Bureau of Labor Statistics, Department of Labor
Dan Doney, CEO, Securrency
Robin Doyle, Managing Director, Office of Regulatory Affairs, JP Morgan
Justin Fessler, Artificial Intelligence Strategist, IBM Federal
Virginia Foxx, U.S. House of Representatives
Jo Guo, Director of Business Solutions Indexes, Morningstar
Nick Hart, Director, Evidence-Based Policymaking Initiative, Bipartisan Policy Center
Yolanda Jones, Director, Office of Grants Systems Modernization, Department of Health and Human Services
Frank Kohstall, Director of Public Affairs, Ohio State Treasurer
Barney Krucoff, CDO, District of Columbia
Andrew Lalor, Assistant Secretary, Data & Digital, Department of the Prime Minister & Cabinet, Australia
Julia Lane, PhD, Professor, Wagner Graduate School of Public Service, New York University
Dave Lindsay, CEO, Delv
Jeremy McQueen, CDO, State of Alabama
Jon Minkoff, CDO, Enforcement Bureau, Federal Communications Commission
Mike Peckham, ReInvent Grants Initiative Lead, Department of Health and Human Services
Mark Reger, Former Deputy Controller, White House Office of Management and Budget
Natalie Rico, Senior Policy Analyst, Management Controls and Assistance, Office of Federal Financial Management, White House Office of Management and Budget
Carlos Rivero, CDO, State of Virginia
Ken Romano, Product Director, Associated Press
Liz Rowe, Former CDO, State of New Jersey
Kris Rowley, CDO, General Services Administration
Laurie A. Schintler, Associate Professor, Schar School of Policy and Government, George Mason Univesity
David Stringfellow, Chief Economist, Office of the Utah State Auditor
Chris Taggart, CEO, OpenCorporates
Marc Teerlink, Global Vice President, SAP Leonardo
Rich Wang, PhD, CDO, State of Arkansas
Jane Wiseman, Innovations in Government Fellow, Ash Center for Democratic Governance and Innovation, Harvard Kennedy School
References
1. For a brief history of the open data movement, see Alison Gill, Adam Hughes, and Hudson Hollister, State of the Union of Open Data, 2016, Data Foundation, December 2016.
2. For a list of interviewees, see Appendix.
3. Joe M. Bohlen and George M. Beal, "The Diffusion Process," Agricultural Extension Service — Iowa State College, Special Report No. 18. 1: 56–77, May 1957.
4. See Wikipedia, “Technology adoption life cycle” page, accessed Nov. 19, 2018.
5. See, e.g., Investaura, “The adoption curve” Web page, accessed Nov. 19, 2018.
6. As described in Section II, below, large majorities of our interviewees for this Third Edition reported progress in the past year on data standardization and data sharing, with slight increases over the Second Edition. Moreover, a significantly higher proportion--93.6% compared to 79.2%--predicted that standardization, sharing, and use would improve further in the next year.
7. See Data Coalition, “OPEN Government Data Act,” (accessed December 22, 2018).
8. Matt Rumsey and Adam Hughes, State of the Union of Open Data, Second Edition, Data Foundation and Grant Thornton, January 2018.
9. See European Securities Markets Authority, “New Rules Make EU Issuers’ Financial Reports Machine-Readable,” December 19, 2017.
10. Id.
11. See https://www.flsenate.gov/Session/Bill/2018/01073.
12. Marc Joffe, “Florida Leads the Way on Budget Transparency with Municipal XBRL,” Data Coalition, April 2018.
13. Jim Harper and Dean Ritz, “Transparent State and Local Financial Reporting: The Case for an Open Data CAFR,” Data Foundation, December 2018.
14. See Securities and Exchange Commission, “SEC Adopts Inline XBRL for Tagged Data,” June 28, 2018.
15. See Data Coalition, “After Five Years the SEC Votes to Adopt Inline XBRL for Corporate Financial Filings,” June 29, 2018.
16. See Data Coalition, “OPEN Government Data Act,” (accessed December 22, 2018).
17. At Data Transparency 2018, representatives of the Commodity Futures Trading Commission (CFTC) and JP Morgan participated in a panel discussion touting the cost-reduction benefits of adopting the LEI as a single standard identification code for legal entities. According to CFTC chief data officer Srinivas Bangarbale, the “LEI has been a lifesaver for the derivatives regulators in understanding activity in a market that is global in reach and vast in scope,” allowing them to track a single entity’s activities across multiple jurisdictions. Data Foundation, Data Transparency 2018 (summary website), October 10, 2018, at Track 2: Compliance slide deck.
18. White House, President’s Management Agenda (website), February 2018, (accessed December 7, 2018).
19. White House, President’s Management Agenda (summary document), February 2018, (accessed December 7, 2018), at page 8.
20. Id. at page 17 (discussing Cross-Agency Priority Goal 2).
21. White House, Federal Data Strategy (website), (accessed December 7, 2018).
22. Id. at Principles.
23. Id. at Practices.
24 Id. at Use Cases.
25. Jack Corrigan, “It’s Time for Agencies to Use and Commercialize Their Data, White House Says,” Nextgov, October 11, 2018.
26. Jessie Bur, “How the administration is tackling federal data challenges,” Federal Times, October 11, 2018.
27. See, e.g., Christian Hoehner, “Administration’s Federal Data Strategy: Opportunities, Limitations, and Context,” Data Coalition, July 16, 2018, (describing how the Federal Data Strategy provides an opportunity and environment for the success specific standardization initiatives).
28. Data Foundation, Data Transparency 2018 (summary website with links to video of keynotes, including address by Assistant Secretary Lalor), October 10, 2018, see also Main Stage and Track 1 slide deck, (slides by Assistant Secretary Lalor at Slide 5, et seq.)
29. Data Foundation, Data Transparency 2018 (summary website with links to video of speeches, including remarks by Fiscal Assistant Secretary Lebryk and Deputy Assistant Secretary Edwards), October 10, 2018, see also Main Stage and Track 1 slide deck, (slides by Fiscal Assistant Secretary Lebryk at Slide 18, et seq.)
30. In September 2018, the Data Foundation and the Democracy Fund hosted a workshop on Capitol Hill to explore never-before-available uses of federal spending data for a Congressional audience. These uses include tracking spending by budget function; comparing an agency’s actual spending to its mandate under the President’s annual budget; tracking all contracts awarded to a particular contractor and its subsidiaries; and tracking all grant spending obligated to the agencies of a particular state. Hudson Hollister, “Federal Spending Data for Congressional Oversight: What’s Possible Right Now, and What Could Be,” Data Foundation, September 13, 2018.
31. Treasury Department, Data Lab (website), (accessed December 7, 2018).
32. U.S. PIRG, Following the Money 2015, March 18, 2015.
33. U.S. PIRG, Following the Money 2018, April 25, 2018.
34. Respondents were asked to rank the three categories. A top ranking was assigned three points, second ranking two points, and third ranking one point. The result was to give management 80 points and 59 points to transparency and automation. Although the scoring method used for 2018’s survey differed from that used for 2017’s survey, the rankings are comparable.
35. Chipo Msengezi and Chris Addison, “From Open Weather Data to Accessible Weather: Information Services for Smallholder Farmers,” CTA Policy Brief No. 16, Technical Centre for Agricultural and Rural Cooperation (2018).
36. Macon Phillips, “Change Has Come to Whitehouse.gov,” The White House Blog, January 20, 2009.
37. Barack Obama, “Transparency and Open Government,” Presidential Memorandum, January 21, 2012.
38. Championed by then-Senator Barack Obama and Senator Tom Coburn, FFATA required the White House Office of Management and Budget to publish information on all federal grants and contracts in an easily searchable and downloadable format. Pub. L. No. 109-282 (September— 26, 2006).
39. See Data Coalition, “DATA Act” web page, (accessed January 16, 2019).
40. See Travis D. Breaux and David G. Gordon, “Regulatory Requirements Traceability and Analysis Using Semi-Formal Specifications” (2013).
41. Department of Education, “Education Department Releases College Scorecard to Help Students Choose Best College for Them” (press release), February 13, 2013, (quoting President Barack Obama).
42. For example, OpenCorporates publishes a version of its corporate identity data set as open data, solicits feedback from users of that data set, and promotes the commercially-sold version of the data set on the basis that user feedback has enhanced its quality. OpenCorporates, “What Makes Our Data Special,” (accessed December 22, 2018).
43. Peter Murray-Rust, “Open Data in Science,” Nature Precedings (March 2008).
44. Australian Government Productivity Commission, “Data Availability and Use,” Productivity Commission Inquiry Report No. 82, p. 129 (March 31, 2017).
45. See Data Coalition, “OPEN Government Data Act,” (accessed December 22, 2018).
For a brief history of the open data movement, see Alison Gill, Adam Hughes, and Hudson Hollister, State of the Union of Open Data, 2016, Data Foundation, December 2016. ↩
For a list of interviewees, see Appendix. ↩
Joe M. Bohlen and George M. Beal, "The Diffusion Process," Agricultural Extension Service — Iowa State College, Special Report No. 18. 1: 56–77, May 1957. ↩
See Wikipedia, “Technology adoption life cycle” page, accessed Nov. 19, 2018. ↩
See, e.g., Investaura, “The adoption curve” Web page, accessed Nov. 19, 2018. ↩
As described in Section II, below, large majorities of our interviewees for this Third Edition reported progress in the past year on data standardization and data sharing, with slight increases over the Second Edition. Moreover, a significantly higher proportion--93.6% compared to 79.2%--predicted that standardization, sharing, and use would improve further in the next year. ↩
See Data Coalition, “OPEN Government Data Act,” (accessed December 22, 2018). ↩
Matt Rumsey and Adam Hughes, State of the Union of Open Data, Second Edition, Data Foundation and Grant Thornton, January 2018. ↩
See European Securities Markets Authority, “New Rules Make EU Issuers’ Financial Reports Machine-Readable,” December 19, 2017. ↩
See European Securities Markets Authority, “New Rules Make EU Issuers’ Financial Reports Machine-Readable,” December 19, 2017. ↩
Marc Joffe, “Florida Leads the Way on Budget Transparency with Municipal XBRL,” Data Coalition, April 2018. ↩
Jim Harper and Dean Ritz, “Transparent State and Local Financial Reporting: The Case for an Open Data CAFR,” Data Foundation, December 2018. ↩
See Securities and Exchange Commission, “SEC Adopts Inline XBRL for Tagged Data,” June 28, 2018. ↩
See Data Coalition, “After Five Years the SEC Votes to Adopt Inline XBRL for Corporate Financial Filings,” June 29, 2018. ↩
See Data Coalition, “OPEN Government Data Act,” (accessed December 22, 2018). ↩
At Data Transparency 2018, representatives of the Commodity Futures Trading Commission (CFTC) and JP Morgan participated in a panel discussion touting the cost-reduction benefits of adopting the LEI as a single standard identification code for legal entities. According to CFTC chief data officer Srinivas Bangarbale, the “LEI has been a lifesaver for the derivatives regulators in understanding activity in a market that is global in reach and vast in scope,” allowing them to track a single entity’s activities across multiple jurisdictions. Data Foundation, Data Transparency 2018 (summary website), October 10, 2018, at Track 2: Compliance slide deck. ↩
White House, President’s Management Agenda (website), February 2018, (accessed December 7, 2018). ↩
White House, President’s Management Agenda (summary document), February 2018, (accessed December 7, 2018), at page 8. ↩
White House, President’s Management Agenda (summary document), February 2018, (accessed December 7, 2018), at page 17. ↩
White House, Federal Data Strategy (website), (accessed December 7, 2018). ↩
White House, Federal Data Strategy (website), at Principles, (accessed December 7, 2018). ↩
White House, Federal Data Strategy (website), at Practices, (accessed December 7, 2018). ↩
White House, Federal Data Strategy (website), at Use Cases, (accessed December 7, 2018). ↩
Jack Corrigan, “It’s Time for Agencies to Use and Commercialize Their Data, White House Says,” Nextgov, October 11, 2018. ↩
Jessie Bur, “How the administration is tackling federal data challenges,” Federal Times, October 11, 2018. ↩
See, e.g., Christian Hoehner, “Administration’s Federal Data Strategy: Opportunities, Limitations, and Context,” Data Coalition, July 16, 2018, (describing how the Federal Data Strategy provides an opportunity and environment for the success specific standardization initiatives). ↩
Data Foundation, Data Transparency 2018 (summary website with links to video of keynotes, including address by Assistant Secretary Lalor), October 10, 2018, see also Main Stage and Track 1 slide deck, (slides by Assistant Secretary Lalor at Slide 5, et seq.) ↩
Data Foundation, Data Transparency 2018 (summary website with links to video of speeches, including remarks by Fiscal Assistant Secretary Lebryk and Deputy Assistant Secretary Edwards), October 10, 2018, see also Main Stage and Track 1 slide deck, (slides by Fiscal Assistant Secretary Lebryk at Slide 18, et seq.) ↩
In September 2018, the Data Foundation and the Democracy Fund hosted a workshop on Capitol Hill to explore never-before-available uses of federal spending data for a Congressional audience. These uses include tracking spending by budget function; comparing an agency’s actual spending to its mandate under the President’s annual budget; tracking all contracts awarded to a particular contractor and its subsidiaries; and tracking all grant spending obligated to the agencies of a particular state. Hudson Hollister, “Federal Spending Data for Congressional Oversight: What’s Possible Right Now, and What Could Be,” Data Foundation, September 13, 2018. ↩
Treasury Department, Data Lab (website), (accessed December 7, 2018). ↩
U.S. PIRG, Following the Money 2015, March 18, 2015. ↩
U.S. PIRG, Following the Money 2018, April 25, 2018. ↩
Respondents were asked to rank the three categories. A top ranking was assigned three points, second ranking two points, and third ranking one point. The result was to give management 80 points and 59 points to transparency and automation. Although the scoring method used for 2018’s survey differed from that used for 2017’s survey, the rankings are comparable. ↩
Chipo Msengezi and Chris Addison, “From Open Weather Data to Accessible Weather: Information Services for Smallholder Farmers,” CTA Policy Brief No. 16, Technical Centre for Agricultural and Rural Cooperation (2018). ↩
Macon Phillips, “Change Has Come to Whitehouse.gov,” The White House Blog, January 20, 2009. ↩
Barack Obama, “Transparency and Open Government,” Presidential Memorandum, January 21, 2012. ↩
Championed by then-Senator Barack Obama and Senator Tom Coburn, FFATA required the White House Office of Management and Budget to publish information on all federal grants and contracts in an easily searchable and downloadable format. Pub. L. No. 109-282 (September— 26, 2006). ↩
See Data Coalition, “DATA Act” web page, (accessed January 16, 2019). ↩
See Travis D. Breaux and David G. Gordon, “Regulatory Requirements Traceability and Analysis Using Semi-Formal Specifications” (2013). ↩
Department of Education, “Education Department Releases College Scorecard to Help Students Choose Best College for Them” (press release), February 13, 2013, (quoting President Barack Obama). ↩
For example, OpenCorporates publishes a version of its corporate identity data set as open data, solicits feedback from users of that data set, and promotes the commercially-sold version of the data set on the basis that user feedback has enhanced its quality. OpenCorporates, “What Makes Our Data Special,” (accessed December 22, 2018). ↩
Peter Murray-Rust, “Open Data in Science,” Nature Precedings (March 2008). ↩
Australian Government Productivity Commission, “Data Availability and Use,” Productivity Commission Inquiry Report No. 82, p. 129 (March 31, 2017). ↩
See Data Coalition, “OPEN Government Data Act,” (accessed December 22, 2018). ↩