Authors
Dean Ritz, Board Member, Data Foundation and Senior Director of Digital Reporting Strategy, Workiva
Contents
Executive Summary
Application of data standards in our society offers potential to ensure potential data users have access to information about what data means. With clear delineation of data meaning, researchers, analysts, and other data users can effectively use data to create value for the economy, policymakers, and society. Data standards promote common understanding and agreement on access to information. When made machine‐readable—a format that can be accessed and used by computers the efficiency and effectiveness of data analysis approaches are enhanced. The application of data standards and machine‐readable data‐reporting processes, such as with regulatory or compliance reporting, is currently underway as disclosure modernization sweeps through industry, academic, and governmental entities.
This paper provides an overview of why machine‐readability matters and asserts that public policy for disclosure modernization should specifically require that both the values that entities report and the compliance standards for reporting those values be structured as machine‐readable data. It concludes by offering three policy recommendations (detailed on pages 23 and 24):
RECOMMENDATION #1: Policymakers should require machine-readability when possible.
RECOMMENDATION #2: Policymakers should clearly communicate intent in legislative and regulatory actions on the role, purpose, scope of detail rendered as data, and applicability of data standards.
RECOMMENDATION #3: Policymakers should encourage the adoption and use of open, consensus standards to encourage cooperation, efficiency, and innovation when drafting new data policies.
Disclosure modernization supports the proper functioning of compliance and financial systems, and most importantly, of governments themselves. The benefits and practical implications are vast, including that standardization builds confidence in compliance and financial systems which quickly and reliably detect fraud, errors, and other concerns. Improving public policies related to disclosure modernization can support efforts to enhance transparency and accountability in our society, ultimately including improving public trust in institutions.
Introduction
“1” is a symbol for the numeral one. Why?
It is because we have generally agreed to it, and that agreement generates value. Analogously, data has its greatest utility when there is agreement as to what it represents. Only then can we access what data means and make effective use of it. Data standards formalize these agreements. With data standards, we can make the information that is important to us (e.g., a trial balance, financial statements, scientific test results, inventories) accessible in a machine‐readable form, that is, in a format that can be easily processed by a computer and, therefore, potential users. This paper first will detail how the quality of data standards determines the effective‐ ness of data; second, it will explain how to elevate machine‐readability requirements to maximize data value; and third, it will offer recommendations to policymakers, particularly those engaged in the areas of legal and regulatory compliance, and evidence‐based policymaking.
Disclosure modernization is the name given to the transition from silos of paper and e‐documents (such as the popular PDF analog of a paper document) to machine‐readable data. It is a movement with active participation by policymakers worldwide. The first wave of this movement captures as machine‐readable data the values contained in compliance reports. The second wave captures as machine‐readable data the compliance standards [1] as well—i.e., the description of compliance requirements and authoritative definitions of the standards as machine‐readable data. Without both, governments have only half of the solution, and are modernizing only part of the available knowledge.
This paper asserts that public policy for disclosure modernization should require that both the values that entities report and the compliance standards for reporting those values be structured as machine‐readable data.
Machine-Readability in Theory and Practice
Background Criteria for Effective Machine-Readable Data
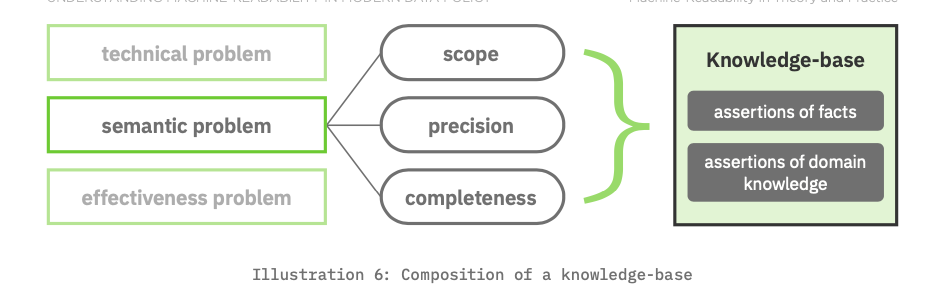
The key to transmitting information successfully is to package it in such a way so as to ensure the end user accepts, interprets, and uses it as intended. Information theory, which provides the conceptual foundation for machine‐readable data, reframes information transmission as three levels of communication problems: (1) the technical problem of how information is transmitted from a sender to a receiver; (2) the semantic problem of how precisely a transmission conveys intended meaning; and (3) the effectiveness problem of the transmission bringing about the desired end.[2]

The effectiveness of communication is dependent on how the technical and semantic issues are addressed. Fortunately, the technical problems associated with transmitting financial data have been solved and already are applied in practice. We have expressive data encoding languages (e.g., XBRL®, XML, JSON, RDF, etc.[3]) complemented by scalable, secure, high‐performance data transmission and storage systems. This leaves us with the semantic problem for machine‐readable compliance reports, and accordingly, the possible semantic solutions are the focus of this paper. The criteria for evaluating semantic solutions are scope, precision and completeness.

First, let’s take the first wave of disclosure modernization where the content of compliance reports are delivered as machine‐readable data. In this context, scope is the universe of what is required to be reported. Precision is the unambiguous meaning of what is reported. Completeness is reporting of all the data that is applicable.
The second wave requires that compliance standards also be represented as machine‐readable data, enabling computers to validate that a report meets requirements for scope, precision, and completeness. This knowledge‐driven automation by machine makes the transition from e‐document and paper reports to machine‐readable data—easier for the preparers of those reports, and easier for the consumers of those reports, too.

To capture both the first and second waves of disclosure modernization we must broaden the definition of the criteria beyond the first wave “what is required to be reported.” Scope now pertains to the breadth of details covered by the information reported and the compliance standards for the report.
In both the first and second waves of disclosure modernization precision remains focused on exactness. Precision eliminates ambiguity and creates consistency. However, precision is not the same thing as accuracy, as one may lie with precision. Ironically, there can be value in working with inaccurate but precisely described data (e.g., anomalous data may indicate fraud or a faulty measuring device).
Lastly, completeness is capturing all of the information required to be effective. In our focus on the second wave of disclosure modernization, this information consists of compliance values and the compliance standards that together bring about automated validation of data quality.
Here is an example of how this works. All accountants know the standard accounting equation of Assets = Liability + Equity. This is knowledge about the domain of accounting. The following example reports values for that equation for two time periods.

From the point of view of a ‘first wave’ person reading this small report, its contents have scope: a value is provided for Assets, Liabilities, and Equity. It also has precision: each has a numeric value, a measurement date, and a unit of measure. And, in the 'first wave' person's interpretation, who we assume knows the accounting equation, it is complete because this person can apply that domain knowledge to the report and see that the equation isn’t satisfied for the period of 2019.[4] A machine‐readable version of these values (i.e., a first wave disclosure modernization report) would not be able to detect the error because the domain knowledge isn’t also machine‐readable.
To be explicit, here is a simplistic machine‐readable version of the report in Illustration 3.

What’s missing from the table in Illustration 4 is the accounting equation, which in our simplified machine‐readable language could look like this:
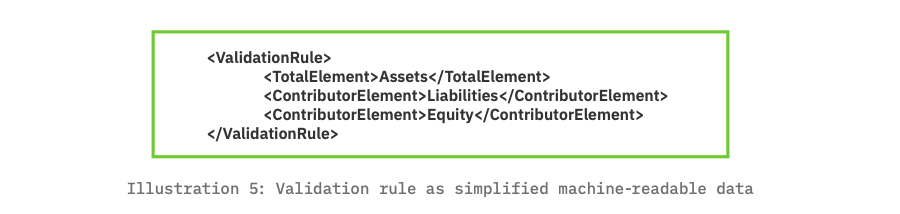
Without the accounting equation, the error is not likely to be detected by a computer. With it, the error will be detectable by a computer.
We now arrive at a bigger picture of the requirements for a semantic solution. With regard to completeness, the data should cover both assertions of fact (i.e., the numbers and their classifications as seen in Illustration 5) and also the assertions of domain knowledge (i.e., compliance rules). These two kinds of assertions together comprise what data scientists refer to as a knowledge‐base.
Finally, regarding computer solutions to semantic problems: Computers have radically improved at appearing to ‘know’ things. Anyone who has voiced a question to a device (e.g., Amazon Alexa or Google Home, or nearly every smartphone) and received a correct answer has direct experience of this. And while generalized machine intelligence is still some time off, artificial intelligence opportunities for policymakers are substantially easier to achieve because there are specific knowledge domains for compliance reports, and these often are well structured.[5]
The domain knowledge of interest is codified by domain‐specific institutions e.g., the SEC, FERC, GASB, FASB, MSRB, EPA, FDIC, etc.[6] Domains have bounded knowledge, and there are human standards for what to report and when to report. Therefore, it is possible to achieve the levels of agreement as machine‐readable data standards that will solve the semantic problem and make compliance reports much more effective. To illustrate this assertion, “An Illustrative Example” presents, and Appendix A dissects in detail, an example financial report to illustrate the kinds of domain knowledge that one would want to present as machine‐readable data and, by doing so, the standards one must satisfy for machine‐readable levels of agreement.
An Illustrative Example
For the benefit of public policy making and performance, and as a general recommendation, the federal government should learn from the data practices of life sciences and intelligence services—domains focused on gathering and analyzing knowledge such as genomic information and intelligence reports. These fields’ charter to protect and save lives increases the necessity for solving communication problems.
Clinical trials and intelligence activities produce enormous quantities of data; the effectiveness of the workers in both of these fields relies on the scope, precision, and completeness of the data, ideally governed through automated processes. What we should singularly learn from the data innovators in life sciences and intelligence services is that data effectiveness increasingly depends upon sophisticated representations of information i.e., through more expressive levels of agreement that address the following premises:
Data producers cannot anticipate all possible uses of their data.
Data users may possess additional knowledge about someone else’s data.[7]
In a given domain, human-readable standards are the foundation for the data standards.
Data automation is the primary means to managing the increasing volume, velocity, and complexity of data.
Evidence-based policymaking is expected by citizens, and is in fact the law of the land.[8]
Like all communication, the evidence used to evaluate activities and work product is effective only if the technical and semantic problems are solved.
What follows is a financial reporting example that will show how this works in practice. The example comes from the Comprehensive Annual Financial Report (CAFR). Nearly 40,000 CAFRs are produced each year by state and local governments and special districts. It is likely more familiar to readers than data from genomic studies or intelligence gathering. The CAFR plays a critical transparency role in the $3.8 trillion municipal bond market,[9] one reason to use the CAFR as an example. Secondly, nearly 30,000 of the 40,000 are provided to the federal government as part of single audit procedures for entities receiving federal grants or awards. Third, moving to machine‐readable data for CAFR could reduce by $30 billion the cost of borrowing by state governments, local governments, and special districts.[10]
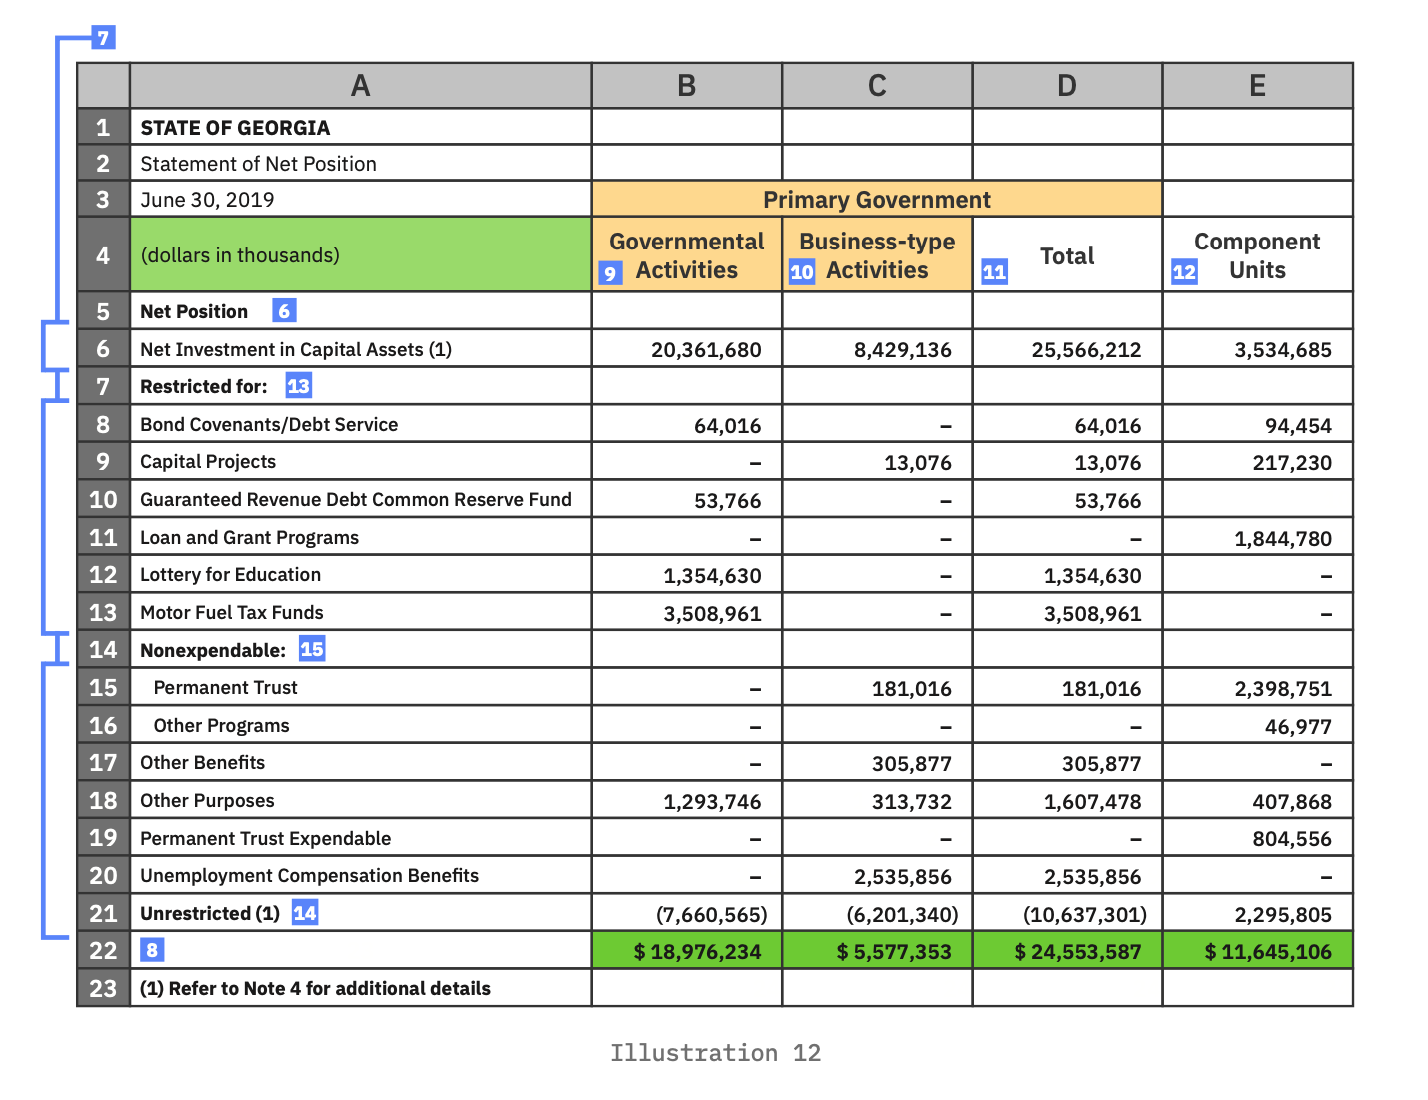
This particular example is from the 2019 CAFR from the State of Georgia.[11] It is considered an excellent example of a CAFR because of the breadth and clarity of this complex 401 page report. This annotated illustration, further detailed in Appendix A, makes observations as seen through the eyes of a subject matter expert (SME) reading theNet Position summary of the Statement of Net Position, both in terms of observations of fact and also the assertions of domain knowledge, i.e., the knowledge that experts bring to the example. Collectively, this is the knowledge‐base we want to capture in a machine‐readable form. Today, this knowledge‐base is inferred by examining a visual presentation of the report.
We start with the first part of assertions of fact: the values.
Each of the 59 numeric values is reported for the government entity called “State of Georgia.”
Each is measured at the end of the fiscal period, June 30, 2019.
Each is reported in thousands of dollars, presumably rounded to the nearest thousand.
All 59 values are classified as net positions. Net position is further classified as one of either restricted and unrestricted funds.
The values in column B are further classified as “Governmental Activities.”
The values in column C are further classified as “Business-type Activities.”
The values in column D are further classified as “Total Primary Government.”
The value of column D should be the sum of the values reported for columns B and C in each respective row (i.e., rows 6, 8-13, 15-16, 17-20). That is, the value reported for Primary Government should be the sum of the value reported for Governmental Activities and Business-type Activities. Take particular note of cell D6. It should equal the sum of B6 and C6. It does not. Similarly, the value of D21 should equal the sum of B21 and C21. It does not. A subject matter expert would notice that they ‘don’t add up’ and would have to investigate further, following the trail that continues through the footnote at the bottom left of the table.
The value of row 22 should be the sum of the values above it in each respective column (i.e., columns B, C, D, and E).
Further classification of net position are found in cells A6, A8:A13, A15:A20, and A21, for the values on each label’s respective row (e.g., “Net Investment in Capital Assets,” “Bond Covenants/Debt Service,” “Capital Projects,” etc.).
This inventory is partial, and would be complemented by the dozens of reporting requirements not mentioned but which must be addressed by those creating or reviewing this report. There are requirements regarding completeness: does the CAFR contain a Statement of Net Position (SNP); does the SNP include all the necessary parts for that statement: assets, deferred outflows, liabilities, deferred inflows, and net position; is the entity identified, and does it comply with the identification requirements?[12] There are requirements regarding consistency: are all the values reported for the same date; and does that date coincide with the end of the fiscal reporting period for the entity?
By making a CAFR machine‐readable in both the reporting of facts and compliance standards, these observations could drive automated validation of correctness and completeness. Project the few observations from one page of a 401 page report, and multiply by the 40,000 produced annually, and one may get a sense of the burden carried by manual efforts to review and audit.
As of this paper’s publication, only one state or local U.S. government has published on its official government website a machine‐readable CAFR (or portion thereof). In 2019, Will County, IL, became the first to do so. [13]
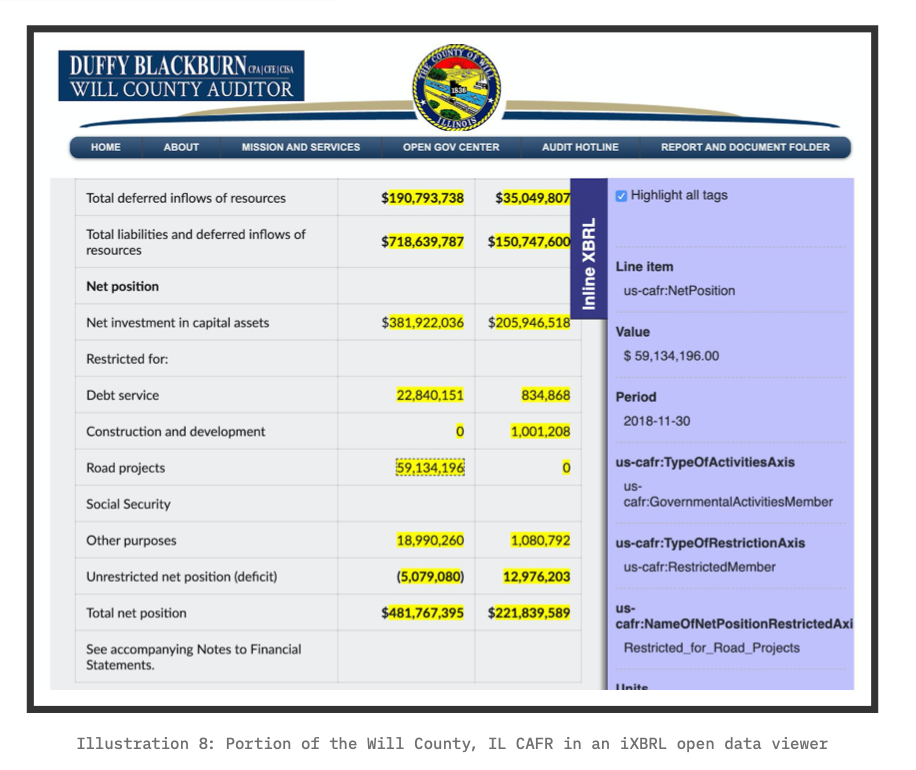
While other states and local governments have considered doing this, public policy does not require it.
The Levels of Agreement for Machine-Readability
Below, we introduce names and brief descriptions of the levels of agreement that may represent the assertions of fact and the assertions of domain knowledge expected from machine‐readable data. These are the six levels of agreement, arranged in order from least to most expressive:
Each is described below.
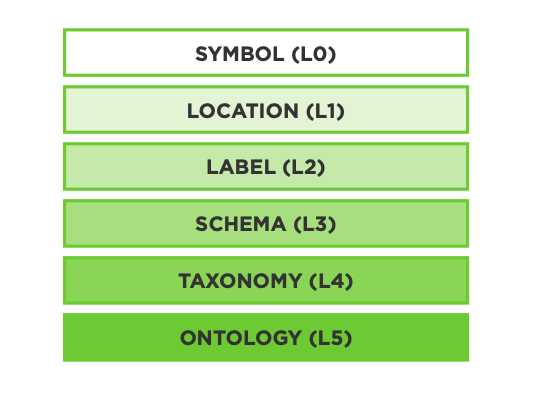
LEVEL 0 (L0): AGREEMENT AS SYMBOL.
This level of agreement is fundamental. It is an agreement that a discrete symbol exists as a unit of information. This unit of information exists prior to interpreting it as meaning something. It is simply a symbol that embodies potential communication that we shall call a datapoint.[14] Lets use the symbol “1” as an example. The person that interprets the “1” symbol as a number is making a small semantic leap based
on cultural agreement; its number‐ness is not intrinsic to the symbol. If the symbol is “one,” a larger semantic leap is required to interpret it as a number. The effective‐ ness of this level of agreement is wholly dependent on the receiver/interpreter of the communication. The symbols that occupy every cell of Illustration 7 express the L0 level of agreement. Even the lines are symbols, and included within L0; the single bar above and the double bars below row 22 in Illustration 7 has meaning to accountants i.e., together they indicate a total.
LEVEL 1 (L1): AGREEMENT AS LOCATION REFERENCE.
This level of agreement captures a means to refer to the physical [15] location of an L0 datapoint. This is common in spreadsheets where references to data are represented as the intersection of a column and row coordinate (e.g., “D13” where the alpha character(s) represent the column and the numeric character(s) represents the row). The interpretation is system‐dependent. For example, a spreadsheet may interpret “=D13” as the value stored in that cell location, whereas a document editor may interpret “=D13” as a piece of text comprising four characters. Some systems permit an L1 reference to include a file system path (e.g., “[../budget/spreadsheet2.xlsx] workbook2:D13”). An L1 reference identifies a datapoint, and uniquely so, but offers no clue as to what will be found there. Every cell of Illustration 7 may be covered by an L0 location reference e.g., the L0 datapoint “13,076” may be referenced by the L1 of “D13.”
LEVEL 2 (L2): AGREEMENT AS LABEL.
With this level of agreement, we finally move from an L0 datapoint as a symbol whose meaning is wholly up to interpretation, to that of having a symbolic clue as to the meaning of the datapoint. The meaning is captured in a label. It is most commonly used as a column or row header of a spreadsheet or table, communicating a convention to human readers to read the label into values in that same row or column (e.g., Illustration 3 where the table’s columns are labeled “Year,” “Assets,” “Liabilities,” and “Equity”). L2 is in widespread use through the comma‐separated values (CSV) data encoding format. CSV files are familiar to almost every spreadsheet user. L2 also is an essential part of relational database management systems (RDBMS). These database systems organize data into tables where each row represents related L0 data points and each column has an L2 label. The label is used by the RDBMS to navigate to the datapoint of interest; a user does not have to know the ordinal position of the desired column as the label alone is sufficient. It is a bonus if that label actually means something by common agreement between the producer and the consumer of the data (e.g., “First Name” and “Surname” in your contact manager). However, the move from L1 to L2 isn’t so simple. Continuing with the example from L1 where “D13” locates the datapoint “13,076”, it is immediately clear that the visual arrangement of the table is not shaped for such a simple singular reference because that datapoint has multiple possible labels due to it having multiple classifications: as pertaining to “Capital Projects,” a “Business‐type Activity,” and a “Total” (i.e., “Primary Government”). The table in Illustration 7 is arranged for human eyes rather than machine‐readable data. This leads us to an important point: machine‐readable data can liberate data from the gridlock of spreadsheets. L2 does not get us there, but the more expressive levels of agreement do achieve this liberation.
LEVEL 3 (L3): AGREEMENT AS SCHEMA.
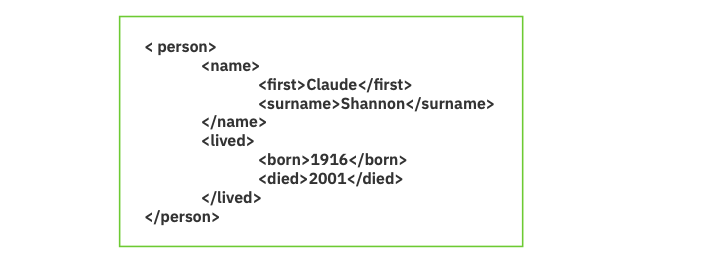
A schema organizes information as a hierarchy, often with an L2 label for each entry in the outline. Below is an example in the computer syntax XML. The data points and their meaning and their relationship between the data points should be obvious even if one does not know the XML syntax. And just as an outline nests information, a schema provides for the nesting of terms (e.g., the term “name” is part of the term “person”; and terms “first” and “surname” are parts of the term “name”. With the introduction of L3 it becomes possible to see how a more expressive level of agreement leads to data consistency. For example, restrictions can be expressed to require a datapoint for “born” but optional for “died”. One may begin to see how L3 is necessary to represent the knowledge‐base of
LEVEL 2 (L2): AGREEMENT AS LABEL.
With this level of agreement, we finally move from an L0 datapoint as a symbol whose meaning is wholly up to interpretation, to that of having a symbolic clue
as to the meaning of the datapoint. The meaning is captured in a label. It is most commonly used as a column or row header of a spreadsheet or table, communicating a convention to human readers to read the label into values in that same row or column (e.g., Illustration 3 where the table’s columns are labeled “Year,” “Assets,” “Liabilities,” and “Equity”).
L2 is in widespread use through the comma‐separated values (CSV) data encoding format. CSV files are familiar to almost every spreadsheet user. L2 also is an essential part of relational database management systems (RDBMS). These database systems organize data into tables where each row represents related L0 data points and each column has an L2 label. The label is used by the RDBMS to navigate to the datapoint of interest; a user does not have to know the ordinal position of the desired column as the label alone is sufficient. It is a bonus if that label actually means something by common agreement between the producer and the consumer of the data (e.g., “First Name” and “Surname” in your contact manager).
However, the move from L1 to L2 isn’t so simple. Continuing with the example from L1 where “D13” locates the datapoint “13,076”, it is immediately clear that the visual arrangement of the table is not shaped for such a simple singular reference because that datapoint has multiple possible labels due to it having multiple classifications: as pertaining to “Capital Projects,” a “Business‐type Activity,” and a “Total” (i.e., “Primary Government”). The table in Illustration 7 is arranged for human eyes rather than machine‐readable data. This leads us to an important point: machine‐readable data can liberate data from the gridlock of spreadsheets. L2 does not get us there, but the more expressive levels of agreement do achieve this liberation.
LEVEL 3 (L3): AGREEMENT AS SCHEMA.
A schema organizes information as a hierarchy, often with an L2 label for each entry in the outline. Below is an example in the computer syntax XML. The data points and their meaning and their relationship between the data points should be obvious even if one does not know the XML syntax.
And just as an outline nests information, a schema provides for the nesting of terms (e.g., the term “name” is part of the term “person”; and terms “first” and “surname” are parts of the term “name”. With the introduction of L3 it becomes possible to see how a more expressive level of agreement leads to data consistency. For example, restrictions can be expressed to require a datapoint for “born” but optional for “died”. One may begin to see how L3 is necessary to represent the knowledge‐base of
LEVEL 2 (L2): AGREEMENT AS LABEL.
With this level of agreement, we finally move from an L0 datapoint as a symbol whose meaning is wholly up to interpretation, to that of having a symbolic clue
as to the meaning of the datapoint. The meaning is captured in a label. It is most commonly used as a column or row header of a spreadsheet or table, communicating a convention to human readers to read the label into values in that same row or column (e.g., Illustration 3 where the table’s columns are labeled “Year,” “Assets,” “Liabilities,” and “Equity”).
L2 is in widespread use through the comma‐separated values (CSV) data encoding format. CSV files are familiar to almost every spreadsheet user. L2 also is an essential part of relational database management systems (RDBMS). These database systems organize data into tables where each row represents related L0 data points and each column has an L2 label. The label is used by the RDBMS to navigate to the datapoint of interest; a user does not have to know the ordinal position of the desired column as the label alone is sufficient. It is a bonus if that label actually means something by common agreement between the producer and the consumer of the data (e.g., “First Name” and “Surname” in your contact manager).
However, the move from L1 to L2 isn’t so simple. Continuing with the example from L1 where “D13” locates the datapoint “13,076”, it is immediately clear that the visual arrangement of the table is not shaped for such a simple singular reference because that datapoint has multiple possible labels due to it having multiple classifications: as pertaining to “Capital Projects,” a “Business‐type Activity,” and a “Total” (i.e., “Primary Government”). The table in Illustration 7 is arranged for human eyes rather than machine‐readable data. This leads us to an important point: machine‐readable data can liberate data from the gridlock of spreadsheets. L2 does not get us there, but the more expressive levels of agreement do achieve this liberation.
LEVEL 3 (L3): AGREEMENT AS SCHEMA.
A schema organizes information as a hierarchy, often with an L2 label for each entry in the outline. Below is an example in the computer syntax XML. The data points and their meaning and their relationship between the data points should be obvious even if one does not know the XML syntax.
And just as an outline nests information, a schema provides for the nesting of terms (e.g., the term “name” is part of the term “person”; and terms “first” and “surname” are parts of the term “name”. With the introduction of L3 it becomes possible to see how a more expressive level of agreement leads to data consistency. For example, restrictions can be expressed to require a datapoint for “born” but optional for “died”. One may begin to see how L3 is necessary to represent the knowledge‐base of a CAFR e.g., the CAFR must include a statement of net position, it must include all the necessary parts for that statement, the report must identify an entity, etc. With a machine‐readable knowledge‐base, software programs may enforce data compliance.
LEVEL 4 (L4): AGREEMENT AS TAXONOMY.
In L3 we use schemas as a means for general purpose representation of structured data. In L4, taxonomy, we use schemas to create a specific and deliberate representation of a classification system, i.e., for each datapoint we can answer the question: “Which box does this go into?” Those who remember high school biology may recall the following taxonomy of organisms: kingdom, phylum, class, order, family, genus, species. One may also recall that the application of a taxonomy usually defaults to applying the most specific classification possible.
A taxonomic specification describes a closed world assumption of what can be known, i.e., what can be put into a domain’s knowledge‐base. In the domain of financial reporting, each financial reporting standard has a human‐readable system for classifying the contents of financial activities in a closed world system. In the U.S., the Financial Accounting Standards Board (FASB) breaks financial activities into the broad classifications of assets, liabilities, equity, comprehensive income, investment by owners, distribution to owners, revenues, expenses, gains, or losses.[16]
The FASB also maintains an implementation of the United States Financial Reporting Taxonomy (USFRT) in the XBRL data encoding language. This taxonomy is used to construct and transmit to the SEC machine‐readable versions of quarterly and annual reports by all U.S. publicly traded companies. This has amounted to more than 270,000 reports in the past decade. The International Accounting Standards Board (IASB) is among the many other financial reporting authorities that maintain a financial reporting taxonomy in a data encoding language; this provides for the exchange of machine‐readable financial reports between regulated entities and oversight bodies.
A taxonomy can have multiple hierarchies i.e., multiple classification schemes, one for each kind of organizing relationship. To illustrate, a taxonomy based on our CAFR example provides for relating the classification of types of net position in a hierarchy of broader‐to‐narrower classification schemes. The CAFR also has a hierarchy of mathematical relationships. These connections between classifications help achieve data quality because they can express the classifications that are permitted to go together, as well as those which are prohibited from going together. In this specific case, and assuming that the GASB guidelines permit this, a GASB taxonomy could explicitly permit data points classified as Capital Projects to be optionally classified as restricted or unrestricted. Alternatively, it instead could require explicit classification as restricted or unrestricted.
Mathematical connections may be treated similarly in a summation scheme i.e., relationships that express how classifications relate by way of summation of numeric values. For example, a taxonomy could express the requirement of assertion 6 i.e., the value reported for Primary Government should be the sum of the value reported for Governmental Activities and Business‐type Activities. These additional constraints further drive classification, and can be used by software to validate the reported data as compliant with the L4 taxonomy and so, at least as modeled in the taxonomy, correct. The expressiveness of an L4 taxonomy in capturing assertions of domain knowledge is part of the reason why taxonomies and suitably expressive data encoding languages have been used by FASB and the IASB for their disclosure modernization work.
LEVEL 5 (L5): AGREEMENT AS ONTOLOGY.
Given the expressive power of a taxonomy, what could an ontology offer? It offers us two significant differences. First, it permits us to specify characteristics about a taxonomy that cannot be described in the taxonomy. Second, an ontology accommodates two key premises of the open world assumption; specifically, data producers cannot anticipate all possible uses of their data, and data users may possess additional knowledge about someone else’s data. An ontology provides flexibility and extensibility to the closed world system of the taxonomy. First, we focus on how the kinds of agreements captured in an ontology accommodate the open world assumption. An open world assumption is managed by focusing on the properties of data rather than its classifications because classifications may change when data is put to new uses, or when additional information becomes available and is added to the knowledge‐base. With a taxonomy, we start with the classification and unpack its properties. In an ontology, we may start with the properties and conclude with a classification. In a taxonomy we ask, “Into which box does this thing go?”In an ontology we ask, “What’s in this box?” In a taxonomy, we know a sparrow is a kind of bird. In an ontology, we would look into our ‘bird box’ and find a sparrow.
An ontology concerns the nature of being, specifying the properties that make a particular thing (e.g., ‘animal_21’) a member of a particular set or multiple sets of things (e.g., a bird). Continuing with our sparrow, an ontological view of birds would identify properties such as:
is an animal
lays eggs
breathes air
has wings
has beak
does not have lips ("has lips" is mutually exclusive of "has beak")
has exactly two feet
This is one ontological description of ‘bird‐ness.’ In data science, an ontology is an “explicit specification of a conceptualization.”[17] With our specification of birdness an item will be classified as a bird when its properties come to satisfy that specification. That item would then be in our ‘bird box’ whether or not someone else has classified it as a bird. If we had an ontological description for flying things we suspect that we would find that all things which satisfy ‘bird‐ness’ also satisfy ‘flying‐things‐ ness,’ and this is a member of more than one set of things (in contrast to a taxonomy where something may be classified as one thing only). Since the open world assumption permits new knowledge to come into the world the classification of things may change. The adaptability of L5 to represent multiple points of view as logical expressions is why ontologies are the conceptual ground for the semantic web.
An ontology can help specify machine‐readable information that can be used to validate the quality of a taxonomy. An ontology allows us to express constraints or requirements on items in our knowledge‐base, including the data that describes a taxonomy. For example, one would think as problematic a taxonomy that enables a data point to be classified as two different things at the same time e.g., as an asset and a liability. This idea of disjointed classifications is a well‐known property of a well‐constructed taxonomy, but it isn’t commonly a machine‐readable property in a taxonomy. The OWL data encoding language for ontologies provides standards for expressing this idea of disjointed classifications, equivalence classifications, pairwise classifications, and more.[18] A computer program, in this case an OWL reasoning system, may be used to validate a set of data—such as a taxonomy—as consistent with an ontology. The widespread use of taxonomies for disclosure modernization have been extremely useful because reporting entities can validate their data as conforming to the data description in a taxonomy. However, experience has shown that reporting entities sometimes construct taxonomies of poor quality,[19] causing the data to be of poor quality too. It is not effective to follow rules that themselves are not effective. Creating an ontology to specify the desired qualities of a taxonomy allows for the automated validation of taxonomy quality, which in turn brings about higher data quality.
These levels of agreement (L0 through L5) have existed in practice for centuries or more. Data encoding languages that represent these levels of agreement as machine‐readable information have existed as non‐proprietary global technology standards for a decade or more. Computer systems that use them also are commonly available to builders of data systems. No new technology needs to be invented.
Disclosure Modernization and U.S. Government Activities
In the U.S. government's 15‐year history of disclosure modernization, three terms have informed federal requirements for disclosure modernization efforts: machine-readable, open data, and disclosure modernization.
As mentioned earlier, “machine‐readable” means readable by computer software. The OPEN Government Data Act of 2018 (Title II of the Evidence Act) goes further, defining “machine‐readable” data as “data in a format that can be easily processed by a computer without human intervention while ensuring no semantic meaning is lost.”[20] The phrase “no semantic meaning is lost” means the data encoding language used must have sufficient resolution to capture meaning. This requirement for resolution drives us towards L4 and L5 (taxonomy and ontology) to ensure that “no semantic meaning is lost.” Yes, a reader of a report may be able to look up a label to discover its meaning but that involves a human being, whereas our goal is to enable a computer to operate without human intervention. The distinct reference to “semantic meaning” also eliminates from consideration e‐documents because, while they offer significant resolution, that resolution represents page layout rather than semantics. At best, e‐documents provide for retrieval based on string searches only.
Open data is machine‐readable data whose syntax is non‐proprietary i.e., a non‐proprietary technical standard, available for use without fees. Two critical points for consideration by policy‐makers are (1) if a standard is actively managed for the benefit of users of the standard, and (2) if fees are charged for users of the standard. Some standards are proprietary, such as the data universal numbering system (DUNS) and also Westlaw citations. Those standards are controlled by their for‐profit owners, and some users are charged fees for use of those standards. In the cases of DUNS and Westlaw citations, several government agencies have mandated their use, and thus their owners have a government‐mandated monopoly. For the eight year period of 2010‐2018, the GSA paid more than $131 million in fees to use DUNS.[21] With open data alternatives to DUNS, [22] this money could be put to better use.
Consensus standards bodies manage and promulgate non‐proprietary standards. The World Wide Web Consortium (W3C) is a prominent example of a consensus standards body. The W3C maintains most of the standards associated with the world wide web including the globally popular data standards of HTML, XML, XLINK, and CSS. The XBRL standard is an open data standard widely used in disclosure modernization efforts globally. The XBRL standard is built on several W3C standards (e.g., XML and XLINK), and is maintained by the global not‐for‐profit consortium, XBRL International Inc. Disclosure modernization is a movement of disclosure and reporting practices from e‐document formats to open data. The goal of disclosure modernization is the exchange of information. And while the Portable Document Format (PDF) does provide for information exchange between persons or between a document editor and printing devices, it is a poor mechanism for exchanging useful data between computer systems. The description of page layout, which is the focus of the PDF, is not suited to working with the document’s contents as semantic data, and therefore PDF is ill suited to automate data aggregation, validation, or analysis.
Government policies and practices are consistently turning in the direction of disclosure modernization. Some federal agencies already have or are actively transitioning to open data for compliance reporting to the government, including the FDIC (in 2005), the SEC (in 2009), and FERC (in 2021). Recent federal laws are bringing this about as a matter of multi‐agency policy practice: the Digital Accountability and Transparency Act of 2014 (DATA Act), [23] the Foundations for Evidence‐Based Policymaking Act of 2018 (Evidence Act),[24] and the Grant Reporting Efficiency and Agreements Transparency Act of 2019 (GREAT Act).[25]
Reaching further back to 2005 is the disclosure modernization work of the Federal Deposit Insurance Corporation (FDIC) and the Federal Financial Institutions Examination Council (FFIEC), the latter's purpose is to promote “uniformity and consistency in the supervision of financial institutions.”[26] The FDIC, one of the members of the Council, implemented the FFIEC’s requirement that banks provide quarterly Reports of Condition and Income (Call Reports) in the XBRL open data format. By doing so, the FDIC replaced a form previously submitted via paper and PDF, collecting approximately 1200 financial statement items. By 2005, about 8000 banks were filing an open data version of their Call Report.[27] The benefits quickly accrued: 100% of data submissions met FFIEC mathematical validation requirements versus 70% in the legacy system; data was made available to agencies within one hour whereas the legacy system required several days; and data availability to the public immediately followed calendar quarter end whereas the legacy system required several weeks.[28] Of further benefit, analysts completed their quarterly reviews seven days faster than they did with the legacy system. The efficiency increase enabled them to increase their caseloads by 20%.[29]
The Securities and Exchange Commission (SEC) in 2009 rolled out a mandate for public company reporting in the XBRL open data language.[30] Since that time, nearly every public company in the U.S. has reported their quarterly and annual reports to the SEC as machine‐readable data. The SEC, through the Financial Accounting Standards Board (FASB) maintains an annually‐updated taxonomy (L4) that public companies use to create their machine‐readable reports. The SEC provides a near‐ real time RSS feed of these submissions. These are used by data aggregators such as Bloomberg and Morningstar, by institutional and retail investors, and by industry institutions. The CFA Institute recently demonstrated the value of this data with their analysis of FASB proposed changes to accounting policies in goodwill accounting.[31] The XBRL data from the SEC was used to evaluate that proposal subsequently to show that the change would result in “the write‐off (amortization) over ten years of $5.6 trillion of assets on the books of U.S. public companies.”[32] Data standards, especially at the more expressive levels of taxonomies (L4) and ontologies (L5), create demonstrably powerful opportunities for analysis.
In 2019, the Federal Energy Regulatory Commission (FERC) adopted a final rule to modernize certain annual disclosures by natural gas and electric utilities.[33] FERC announced its transition to standardized, machine‐readable data to make it easier for companies to submit data and to enable FERC and other market participants to provide a faster, more accurate analysis of this energy company data. FERC also believes that, over time, this change will lower costs associated with preparing and filing compliance reports. Of great importance for their oversight responsibilities, FERC expects efficiency improvements similar to those experienced by the FDIC: to process and analyze the data more quickly and correctly, and optimize caseload management. FERC expects their machine‐readable program to be operational in 2021.
These are highlights of disclosure modernization efforts at the federal level. Many others exist at the agency level,[34] such as disclosure modernization for asset‐backed securities disclosure and registration,[35] money market fund reform, amendments to Form PF, [36] crowdfunding, [37] and the listing standards for recovery of erroneously awarded compensation.[38]
These agency‐specific modernization efforts are complemented by broader efforts that affect multiple agencies. The DATA Act required the U.S. Department of the Treasury to “establish Government‐wide data standards for financial data and provide consistent, reliable, and searchable Government‐wide spending data that is displayed accurately for taxpayers and policymakers.”[39] The Treasury completed implementation on time (May 2017) and within budget.
Additional efforts also are underway across agencies through the Foundations for Evidence‐Based Policymaking Act of 2018 [40] and the Grant Reporting Efficiency and Agreements Transparency Act of 2019 [41] (the GREAT Act). In fact, disclosure modernization efforts are well under way in every country of the European Union and many other countries around the world. This global effort is well past being a trend.

National, state, and local governments are major producers and consumers of data. Of the total $4.1 trillion outlay of the U.S. Federal Government in FY 2018, $2.25 billion [42] was spent on the 13 principal statistical agencies.[43] The need for data is clear. Therefore, we believe it is proper and beneficial public policy to promote disclosure modernization in order to maximize the value that may be extracted from this data.
The Data (R)evolution is Machine-Readable
The concepts of data and data standards are not new. The history of data parallels the development of science, and with science the development of complex societies. As social creatures it seems obvious we would establish socialization of our data, too, speedily sharing the benefits of experience and knowledge. In this collaboration both social and scientific, standards matter, and over time scientific advances were accompanied by advances in data practices.
The Scientific Revolution was a Data Revolution
Aristotle, as our first natural philosopher (4th Century BC), engaged in the scientific study of life. More than just noting observations he recorded them in structured form. In reading an excerpt of his observations one can see the structured, logical thinking in his prose.
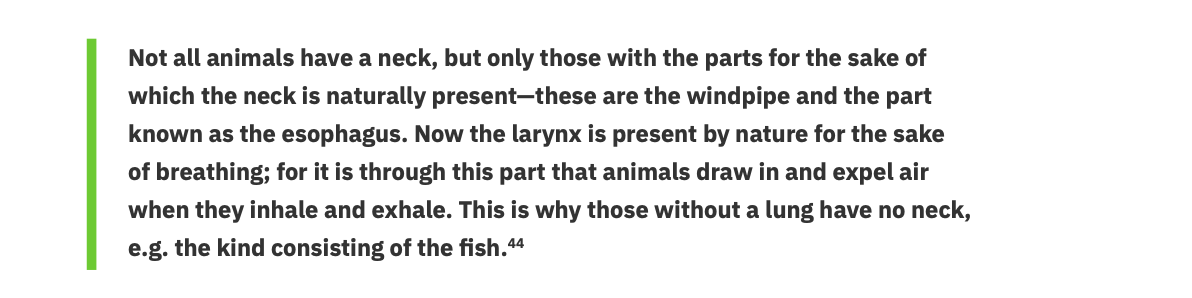
Readers can imagine how this prose might be the basis for a table detailing characteristics of animals, with discrete columns and conclusions reached by the analysis of the values in those columns.
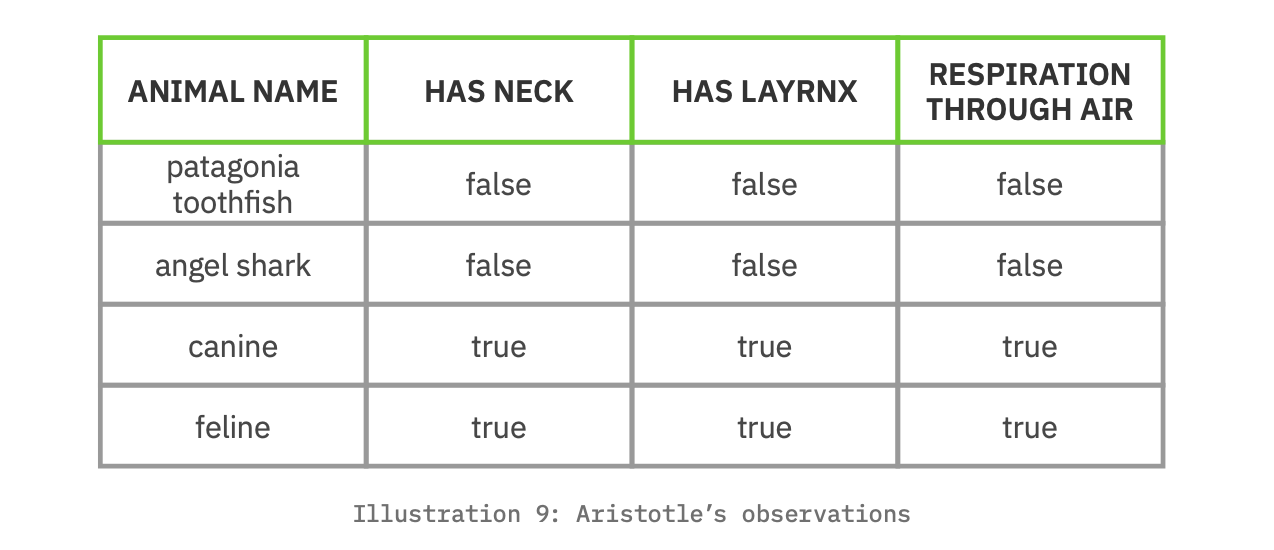
Aristotle developed ontologies for the natural world, achieving two thousand years ago the level of agreement that this paper today advocates for as L5. The scientific revolution of the 17th Century raised more stringent methods for validating observations and conclusions, and added expectations about the reproducibility of the results. Reproducibility drives agreement as to the meaning of data. This is why the scientific revolution also was a data revolution.
The Industrial Revolution was a Data Standards Revolution
The industrial revolution was characterized by production moving from assembly by hand and individual craft to assembly largely by machine and process. An assembly line with its interchangeable parts requires agreement on inputs and outputs. [45] Agreement is what makes parts interchangeable and thus a conceptual asset essential to the industrial revolution.
The development of the rail system provides a direct analogy to data. There was a time when railroad gauges were not standardized. When it came time to transfer goods from one train system to another, the cargo had to be transferred because the rail cars with incompatible gauges could not. Is this not similar to cutting and pasting between documents because the document formats are proprietary?Containerized shipping, first practiced in 1956,[46] advances this data metaphor. Container standards enabled the same containers to be moved by ship and train and truck. The next advancement was to standardize the means of discovering the content of a container without unpacking. This was achieved by attaching RFID tags to the contents, making containers self‐describing. This self‐identification and self‐description are conceptual assets essential to disclosure modernization.
The Internet Revolution was a Data Sharing Revolution
The Internet is, perhaps, the most visible example of data standards. It is the accumulation of various technical standards managed by domain‐specific voluntary consensus standards bodies including the W3C, the Object Management Group (OMG), and the ISO. The movement to open source software provides standards for processing data. Contributions to the commonwealth of open source software comes from for‐profit companies who recognize that such contributions ‘raise all boats’ including theirs. Consider the data challenges if there were proprietary languages for describing the content of a web page. Every web page would have to be reworked in each proprietary web page language and tested against each proprietary browser. Thankfully, it didn’t play out in a proprietary model; the World Wide Web defeated proprietary on‐line systems such as America Online (AOL) and Prodigy.We now arrive at the currently active revolution, often called the ‘fourth industrial revolution’ where the data, in some sense, has left people behind and is able to collaborate independently of us.
Amidst a Data Intelligence Revolution
The data intelligence revolution began when people figured out systems and methods for mining data to extract valuable patterns. This domain of systems and methods is called machine learning (ML), which is part of the larger computer science domain of artificial intelligence (AI). In the past decade, AI has become a power tool, enabling computers to do tasks previously seen as the exclusive domain of human persons or even beyond the scope of both persons and hand‐coded computer programs. As a tool, AI is something that changes the scale of one's capabilities, just as a bicycle changes the scale of distance—i.e., biking 5‐miles takes less effort than walking. Machine learning changes the scale of pattern recognition, a fundamental tool of human intelligence that enhances our ability to recognize, classify, store, and use information effectively. With machine learning, we can learn from more examples than is possible for an individual person to review, and we may see patterns that would otherwise be invisible to the person.
Let’s take an example based on optical character recognition. With machine learning a computer can learn to classify a set of pixels as a particular alphabetic character. It can then apply these learned classifications to new samples of pixel patterns to predict the alphabetic character represented by each sample. The example below illustrates the relationship between observation and classification. [47]
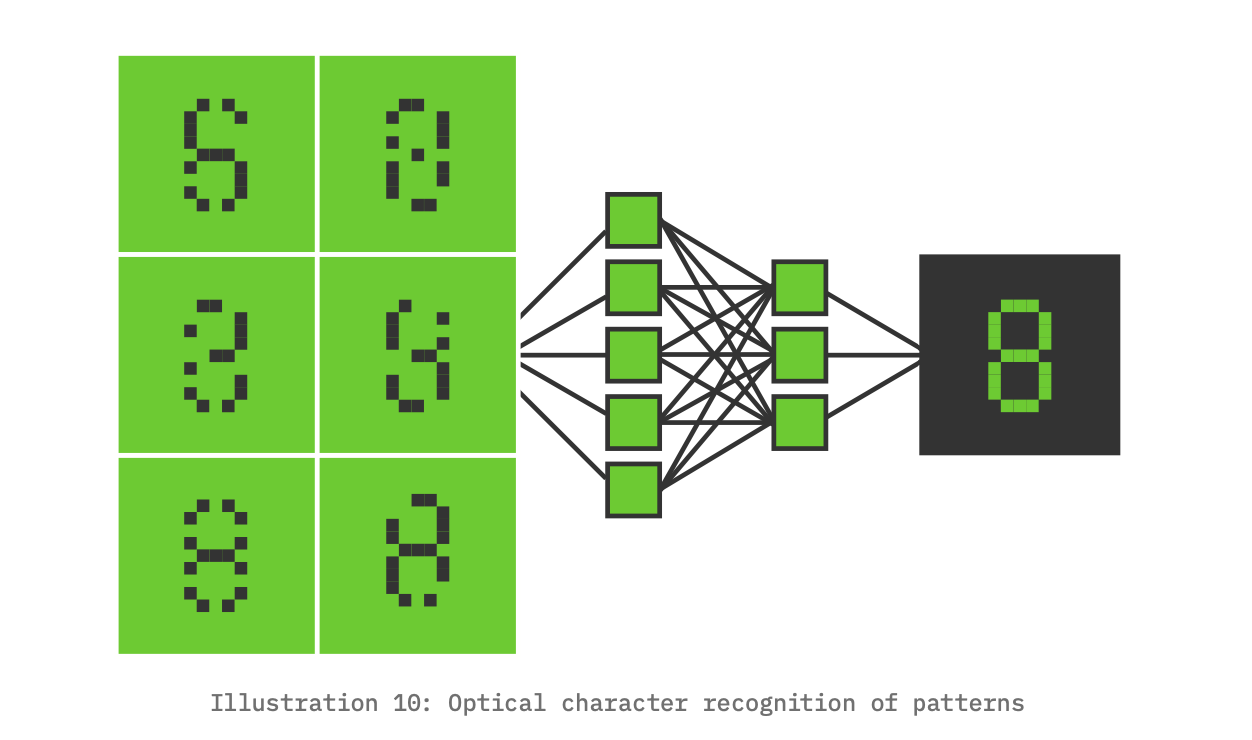
Through an iterative self‐training process, machines discover hypothetical patterns in data sets, and then apply this learning to detect these patterns in new data sets. The domain of reading an MRI similarly requires training, and radiologists have received special training to learn already‐known patterns and then recognize these patterns in new MRI scans of patients. Machine learning changes the scale for the value extracted from an MRI because the machine's training can be done over millions of scans and detect patterns at the pixel level—both of these are at a scale that cannot be performed by humans. This is similar optical character recognition which can detect characters in a bitmap—even a noisy bitmap. The idea of patterns is crucial to the data intelligence revolution.
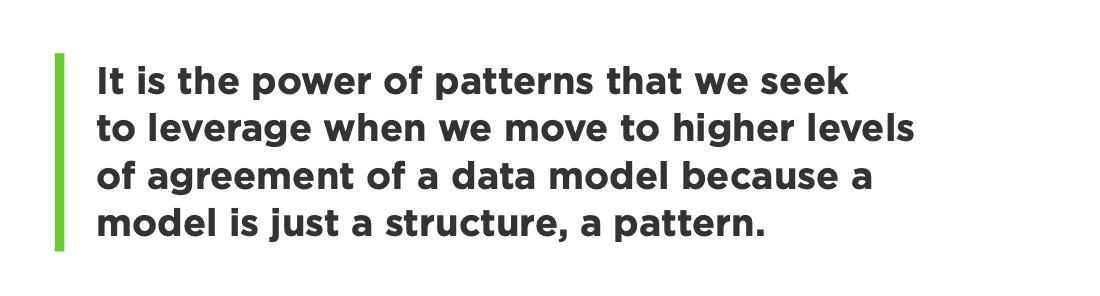
Whether it is reading MRI scans, programming self‐driving cars, or compliance reporting, the potential value may be enhanced by the qualitative understanding of the data model—the data patterns—and the agreement we have on those models.
It is timely to ask, Why can’t ML be used for compliance reporting? Why bother with creating an explicit model of a compliance report when we have the option to let a computer ‘machine learn’ the model? To get to an answer, let’s compare the starting points in each of the noted examples: MRI reading, self‐driving cars, and compliance reporting. The model of an MRI scan is very simple; it is just bits comprising a visual image; it is a model based on a single kind of thing or element: the pixel. Since the model is relatively simple, ML can efficiently learn to detect patterns and anomalies.
Software for a self‐driving car is different because it has to learn to navigate a seemingly much more complex model with more variables. Using a generated‐from‐scratch ML model for self‐driving cars would require an immense amount of power with limited payoff. In this case, it is much more efficient to begin with an existing human‐designed model that provides significant scope and precision. Specifically, the existing human‐designed model provides more scope via multiple elements (e.g., transportation surfaces, traffic signals) and more precision via multiple attributes about each type of element (e.g., a traffic surface’s attributes may represent speed limit, surface material and thickness, vehicle weight limit, etc.). In this case, software doesn’t need to use ML to infer elements and attributes from a blank slate because a useful model already exists. Using this human‐described model is much more effective and efficient than trying to ask the machine to infer all of these patterns from scratch.
The human standards help in another way. Programming a self‐driving car should distinguish between common practice and prescribed practice. Consider the common practice that most but not all cars stop at red lights and stop signs.The prescribed practice is that all cars stop at red lights and stop signs. Surely, we want our self‐driving cars to adhere to the prescribed practice while at the same time taking common practice into account when predicting the behavior of other cars.
The analogy between self‐driving cars and compliance reporting is useful here. We have an existing human‐designed model for compliance reporting, and that model has value because it accurately describes an idealized compliance reporting system. We also want compliance reporting to follow prescribed practices for data entry rather than the common practice which may contain errors or fraud. Therefore, instead of having software learn from millions of data sets some of which contain errors and fraud we want to encode the human‐designed model into the data standards so that machines are learning from the ideal set of standards and can distinguish them from reports which deviate from the ideal standards. We want to detect financial malfeasance (e.g., see Enron, and MCI Worldcom) not emulate it.
Compliance reports, particularly financial reports based on GAAP standards, are well‐described logical systems that describe practices worth emulating. Encoding these logical systems into a machine‐learning system allows the computer to use these human‐derived standards to arrive at conclusions about compliance data. The encoding of logical relationships is what allows for inferences to be made, for reasoning to be applied. Returning to the accounting equation Assets = Liabilities + Equity, what we have is a logical assertion, i.e., that a value reported for Assets should equal the sum of the values reported for Liabilities and Equity. This logical relationship defines a pattern which can then be used by machine learning to detect situations where the assertions of fact do not comply.
Section Conclusion
In 1892, philosopher and psychologist William James wrote, “In a system, every fact is connected with every other by some thought‐relation. The consequence is that every fact is retained by the combined suggestive power of all the other facts in the system.”[48] The development of human knowledge is the practice of making connections. It may seem a leap to relate philosophy and psychology to compliance reporting, yet it is a pragmatic leap. Disclosure modernization should make that leap, too, to connect people and organizations with compliance data and compliance reports. With this in mind, we recommend compliance standards as well as compliance data be machine‐readable so these connections can be made.
Conclusion
Policy Recommendations
Three core recommendations extend naturally from the framework and information presented in this paper.
RECOMMENDATION #1:
Policymakers should require machine-readability when possible. Public policy for disclosure modernization should require both the reported compliance values and the compliance standards to be machine‐readable. Machine‐readable compliance standards enable technical innovations for automated reporting and data validation to reduce the compliance burden. Encoding domain knowledge as machine‐readable data measurably improves the opportunities for analysis by both conventional and machine‐learning methods, reducing the cost of governmental and stakeholder oversight while also increasing its effectiveness. Policymakers could implement this recommendation by incorporating language in proposed bills, regulations, and even guidance documents requiring machine‐readability, similar to the standard applied in the OPEN Government Data Act.
RECOMMENDATION #2:
Policymakers should clearly communicate intent in legislative and regulatory actions on the role, purpose, scope of detail rendered as data, and applicability of data standards. The second recommendation is a necessary technical complement to the first. We recommend that federal data policy pursue disclosure modernization where data standards are expressed as L4 taxonomies or L5 ontologies. The transition to disclosure modernization recognizes modernization as a necessary commitment by the regulated and the regulators to ensure the integrity of compliance, evidence‐based policymaking, and capital markets. Modern data practices reflect the understanding that all data are not created equal. More sophisticated demands upon data require more expressive levels of agreement for data standards. Modern data policy should communicate intent by describing the levels of agreement for data that should be met by those implementing policy. For compliance reporting, the very real necessity for data effectiveness (as noted in Recommendation #1) is met only by the more expressive levels of agreement on data standards: L4 taxonomies and L5 ontologies. Legislators can specifically support implementation of this recommendation by including expectations and purposes for data standards when drafting legislation, through bill text or committee reports. Similarly, regulators can better support this recommendation by clearly establishing expectations for standard effectiveness through proposed regulatory actions and guidance documents.
RECOMMENDATION #3:
Policymakers should encourage the adoption and use of open, consensus standards to encourage cooperation, efficiency, and innovation when drafting new data policies. The third recommendation is that technology choices should minimize the technical and intellectual property obstacles to sharing and aggregating data. The goal is to enable agencies and data users—both public and private—to combine and analyze data (within statutory limits). The earlier example of the DUNS number is instructive as to the obstacles to effectiveness and the significant financial costs that proprietary standards bring. Open source software and mature data encoding standards that are free to use without restrictions and maintained by voluntary consensus bodies are multipliers of innovation. Governments should follow private enterprise in realizing the benefits of this technical and social cooperation. Policymakers can specifically incorporate these approaches by explicitly recognizing in legislative and regulatory actions the availability and prioritization of existing open standards when implementing new directives and policies.
Closing
Legislators and executive agency policy making in this area should address the three recommendations in Section 4.1, establishing disclosure modernization not just as best practice but as the standard practice. We summarize the practical implications of these recommendations:
Government agencies and other data consumers will be able to automate validation of data quality, the completeness of a reported data set, and the consistency of that data set. Further, they will be able to maintain effectiveness even as data volume and velocity increase.
The machine-readable data will be detailed, high quality, and timely, available for both conventional analysis and the innovative analysis achieved by machine-learning and artificial intelligence platforms.
It will build confidence in compliance and financial systems because with this data, fraud is caught more readily and earlier.
People will be able to understand who gets funding and when, and how that funding is being utilized. This will improve government accountability and the performance of programs.
Audits and data analysis will be democratized because vetted data is made available earlier, with greater scope, precision, and completeness.
The data is a shared resource for citizens. This transparency encourages citizens to trust and engage their government. This trust is essential when a nation faces major events and crises (e.g., a pandemic, a natural disaster, a man-made disruption to infrastructure and/or society).
Policymakers should recognize that disclosure modernization as described here supports the legitimacy and the proper functioning of compliance and financial systems, and most importantly, of governments themselves.
Appendix A
Detailed Example
Below is a more thorough dissection of the example report from Section 2.2 and contains all of the observations from that section. Four sequenced illustrations capture the observations as seen through the eyes of a subject matter expert (SME) reading the Net Position summary of the Statement of Net Position. Illustrations 11 and 12 highlight the assertions of fact i.e., the values, and the classification(s) of these values. Illustrations 13 and 14 highlight the assertions of domain knowledge, i.e., the knowledge that experts bring to the example. Collectively, this is the knowledge‐base we want to capture in a machine‐readable form.

We start with the first part of assertions of fact: the values.
There are 59 values in this section of the report.
Each is reported in US dollars (though only 4 are labeled as such).
Each is reported in thousands, and we infer them to be rounded to the nearest thousand.
Each is measured at the end of the fiscal period, June 30, 2019. 5. Each is for the government entity called “State of Georgia.”
The next illustration adds the classification(s) of each value, all of which are authoritatively defined by the Governmental Accounting Standards Board (GASB); local jurisdictions may provide further classifications within the GASB guidelines.[49] The assertions of fact consist of the values and their classification(s). Classifications assert the ‘what’ that is being measured by the values. For example, cell D9 contains the value 13076. Given the visual cues of the table, it is classified as the US dollar amount in thousands that is (a) “Restricted” to (b) “Capital Projects” of a (c) “Business‐type Activity” of the (d) “Primary Government.” As you may see from this example, a single value may have more than one classification. In these cases, it is classified as the aggregate of individual classifications.
6. All 59 values are classified as net positions.
7. Further classification of net positions are found in cells A6, A8:A13, A15:A20, andA21, for the values on each label’s respective row.
8. The values in B22, C22, D22 and E22 are not explicitly classified. A SME would assume, because of the bar above and the double bars below the value, that this is the total net position for each of columns B, C, D, and E.
9. The values in column B are classified as “Governmental Activities.”
10. The values in column C are classified as “Business-type Activities.”
11. The values in column D are classified as “Total Primary Government.”
12. The values in column E are classified as total “Component Units.”
13. The net position classifications in cells A6 through A20 are further classified as restricted and expendable, or restricted and nonexpendable. From the point of view of a data consumer, it may be useful to think of expendable/nonexpendable as a classification of a classification because they apply only to net positions that are restricted. By having expendable/nonexpendable be a classification
of restricted, a user could query the report to discover which restrictions were expendable and which were not. This is a query to learn about the nature of a government’s organization rather than the values reported.
14. This complements A13 by classifying unrestricted items of net position, and it reinforces the value in classifying the state of restricted/unrestricted as separate from the classification of the different net positions.
15. This classifies net positions that are nonexpendable e.g., a trust. A SME would know that a trust may have an expendable portion e.g., a scholarship trust whose principal is not expendable but whose earning on the principal is expendable. An assumption is made that all the other classifications of A6 (other than rows 15 and 16) are classified as expendable.
Illustration 9 highlights some mathematical relationships that contribute to the domain knowledge.

The specific observable mathematics:
16. The value of row 22 should be the sum of the values above it in each respective column (i.e., columns B, C, D, and E).
17. The value of column E should be the sum of the values reported for columns B and C in each respective row. That is, the value reported for Primary Government should be the sum of the value reported for Governmental Activities and Business-type Activities.
18. According to A17 above, D6 should equal the sum of B6 and D6; and the value of D21 should equal the sum of B21 and C21. They do not. The SME would notice that they ‘don’t add up’ and would have to investigate further, following the trail that continues through the footnote at the bottom left of the table.
Finally, illustration 10 highlights some of a SME’s non‐mathematical domain knowledge. It is presented as a checklist to reflect how a SME might mentally ‘check off’ each as they either construct this statement as a preparer, or when they review the statement as a reader. In fact, the Government Financial Officers’ Association (GFOA) has published and maintains a CAFR checklist[50] that is more detailed than the items below.[51] Detailed or not, currently, checklists like these are performed manually with eyeballs and writing utensils. Effective disclosure modernization would enable automation of this production and review, and by doing so, promulgate the domain knowledge for compliance, mitigate inconsistencies, and detect or discourage fraud.[52] As a preparer or reader, building compliance knowledge into the data is tremendously valuable.

19. Does the CAFR contain a Statement of Net Position (SNP)?
20. Does the SNP include all the necessary parts for that statement: assets, deferred outflows, liabilities, deferred inflows, and net position? For our example above, we represent just the net position, so clearly this is not a complete SNP.
21. Is the entity identified? Does it comply with the identification requirements? The identification scheme is important because, for example, 31 states have a “Washington” county, and 28 have a “Jefferson” county.
22. Are all the values reported for the same date? Does that date coincide with the end of the fiscal reporting period for the entity?
523. Does the SNP contain information for governmental activities, business-type activities, and then primary government?
24. Does the SNP contain information for all discretely presented component units?
25. Does the SNP provide a total net position for governmental activities, business-type activities, primary government, and the discretely presented component units?
26. Net position may be classified as (a) net investment in capital assets, (b) restricted net position, or (c) unrestricted net position.
27. Does total net position equal the sum of net investment in capital assets, total restricted net position (expendable and nonexpendable), and total unrestricted net position? This particular example does not provide subtotals.
28. Are the components of restricted net position identified as expendable or nonexpendable?
Automated validation requires that this domain knowledge be machine‐readable. Additional domain knowledge that is desirable to capture are the connections between these particular value assertions and those reported elsewhere in the CAFR. These connections can be used to validate consistency of the entire CAFR.
Appendix B
A Summary of Technical Assertions
A summary of this paper’s technical assertions follows:
A data standard represents agreement between a sender and a receiver regarding the transmission of data.
Data may contain assertions of fact and assertions of domain knowledge; together they comprise the knowledge-base.
The quality of a data standard determines the potential value of the data.
The three classic problems of communication are the technical problem, the semantic problem, and the effectiveness problem.
Scope, precision and completeness serve as criteria for evaluating the effective- ness of a semantic solution.
We can categorize data standards as expressing one or more levels of agreement.
These are the six levels of agreement, arranged in order from least to most expressive: agreement as symbol (L0), agreement as location (L1), agreement as label (L2), agreement as schema (L3), agreement as taxonomy (L4), and agreement as ontology (L5).
Picking the level of agreement that best matches the knowledge-base is key to making the data standard effective.
Endnotes
A very small sample of the numerous compliance standards that apply in the U.S. are the Health Insurance Portability and Accountability Act (HIPAA), the Federal Information Security Management Act (FISMA), FedRAMP, Sarbanes‐Oxley Compliance (SOX), the Securities Act of 1933, the Securities Exchange Act of 1934, General Data Protection Regulation (GDPR), etc. Compliance standards maintain the stability and predictability of systems. The same may be said of compliance standards as was said by Oliver Wendall Holmes Jr. about taxes: “[They] are the price we pay for civilization."
Shannon, C. E., & Weaver, W. (1949). The Mathematical Theory of Communication. University of Illinois Press.
The acronyms represent: eXtensible Business Reporting Language, eXtensible Markup Language, JavaScript Object Notation, and Resource Description Framework, respectively.
Good for you, if you already noticed this.
As one example, accounting standards often are represented as codifications to indicate the rigor of this domain knowledge.
The acronyms represent the Securities and Exchange Commission, the Federal Energy Regulatory Commission, the Governmental Accounting Standards Board, the Financial Accounting Standards Board, the Municipal Securities Rulemaking Board, the Environmental Protection Agency, and the Federal Deposit Insurance Corporation, respectively.
Also known as the open world assumption.
Foundations for Evidence‐Based Policymaking Act of 2018, P.L. 115‐435 (2019). https://www.congress.gov/115/plaws/publ435/PLAW‐115publ435.pdf
Municipal Securities Rulemaking Board. (2019). Muni Facts. http://www.msrb.org/msrb1/pdfs/MSRB‐Muni‐Facts.pdf
Ang, A. and Green, R. (2011). Lowering Borrowing Costs for States and Municipalities through CommonMuni. The Hamil‐ ton Project, Brookings Institution.
State Accounting Office, State of Georgia. (2019). Comprehensive Annual Financial Report Fiscal Year Ended June 30, 2019, p. 31. https://sao.georgia.gov/statewide‐reporting/comprehensive‐annual‐financial‐reports
The identification scheme is important because, for example, 31 states have a “Washington” county, and 28 have a “Jefferson” county.
Blackburn, D. (2018). Comprehensive Annual Financial Report, County of Will, IL. Will County Auditor. https://www.willcountyauditor.com/xbrl‐cafr‐2018
“Infon” is a specialized term for a unit of information.
We use the word “physical” in the logical sense of spatial location such as a spreadsheet coordinate. The true physical location, of course, is in computer storage.
These are the classifications defined by the Financial Accounting Standards Board (1985). Statement of financial account‐ ing concepts no. 6: Elements of financial statements. https://www.fasb.org/pdf/aop_CON6.pdf
Gruber, T.R. (1993). Toward principles for the design of ontologies used for knowledge sharing. International Journal of Human‐Computer Studies, 43(5‐6), p. 908.
The Web Ontology Language (OWL) is a language standard managed by W3C. For a terse summary of its standard terms see OWL 2 Reference Card. (2009, October 18). W3C. http://www.w3.org/2007/OWL/refcard
Some reporting regimes permit reporting entities to modify the standard taxonomy (e.g., SEC public company reporting). The quality of these modifications vary. Other reporting regimes severely restrict taxonomy modifications (e.g., FERC).
Definitions, 44 U.S. Code § 3502. Government Publishing Office. https://www.govinfo.gov/app/details/USCODE‐2011‐ti‐ tle44/USCODE-2011‐title44‐chap35‐subchapI‐sec3502
Miller, J. (2017, February 21). GSA gives the ‘dump DUNS’ movement more hope. Federal News Network. https://federal‐ newsnetwork.com/reporters‐notebook‐jason‐miller/2017/02/gsa‐gives‐dump‐duns‐movement‐hope/
One promising open data alternative is managed by the consensus standards body, Global Legal Entity Identifier Foundation. See Global Legal Entity Identifier Foundation. (2020). www.gleif.org
DATA Act, S.994 (2014). https://www.congress.gov/bill/113th‐congress/senate‐bill/994
Foundations for Evidence‐Based Policymaking Act of 2018, P.L. 115‐435 (2019). https://www.congress.gov/115/plaws/publ435/PLAW-115publ435.pdf
Grant Reporting Efficiency and Agreements Transparency Act of 2019, P.L. 116‐103 (2019). https://www.congress.gov/116/plaws/publ103/PLAW‐116publ103.pdf
FFIEC Home Page (2019). Federal Financial Institutions Examination Council. https://www.ffiec.gov/
Federal Financial Institutions Examination Council (March 30, 2006). FFIEC Annual Report 2005, p. 12. https://www.ffiec.gov/PDF/annrpt05.pdf
XBRL U.S.. FDIC Reporting. https://xbrl.us/home/filers/fdic‐reporting/
Federal Financial Institutions Examination Council (2016, December). Improved business process through XBRL: A use case for business reporting, p. 6. https://xbrl.us/research/ffiec‐2007/
See Securities and Exchange Commission (January 2, 2009). Final Rule: Interactive Data to Improve Financial Reporting, Release No. 33‐9002. https://www.sec.gov/rules/final/2009/33‐9002.pdf
FASB (2019, July 9). Invitation to comment: Identifiable intangible assets and subsequent accounting for goodwill. https:// www.fasb.org/jsp/FASB/Document_C/DocumentPage?cid=1176172950529
CFA Institute (2020, January 13). Comment letter no. 103: Re: Invitation to comment (ITC), identifiable intangible assets and subsequent accounting for goodwill. https://www.fasb.org/cs/BlobServer?blobkey=id&blobnocache=true&blobwhere=1175836097338&blobheader=application%2Fpdf&blobheadername2=Content‐Length&blobheaderna‐ me1=Content‐Disposition&blobheadervalue2=1437883&blobheadervalue1=filename%3DINTANGGW.ITC.103. CFA_INSTITUTE_SANDRA_J._PETERS.pdf&blobcol=urldata&blobtable=MungoBlobs
Federal Energy Regulatory Commission (2019, June 20). Final Rule: Revisions to the Filing Process for Commission Forms, Docket No. RM19‐12‐000; Order No. 859. https://www.ferc.gov/whats‐new/comm‐meet/2019/062019/M‐1.pdf
Joffe, M.D. (2018). Open data for financial reporting: Costs, benefits, and future. Data Foundation, pp. 35‐36. https://www.datafoundation.org/xbrl‐report‐2017/
SEC Asset‐Backed Securities Disclosure and Registration Rule, 79 FR 57183, Federal Register (2014). https://www. federalregister.gov/articles/2014/09/24/2014‐21375/asset‐backed‐securities‐disclosure‐and‐registration
SEC Money Market Fund Reform Rule; Amendments to Form PF, 79 FR 47735, Federal Register (2014). https://www. federalregister.gov/articles/2014/08/14/2014‐17747/money‐market‐fund‐reform‐amendments‐to‐form‐pf
SEC Crowdfunding Rule, 80 FR 71387, Federal Register (2015). https://www.federalregister.gov/arti‐ cles/2015/11/16/2015‐28220/crowdfunding
SEC Listing Standards for Recovery of Erroneously Awarded Compensation Release Nos. 33‐9861, 34‐75342, IC‐31702; File No. S7‐12‐15 (proposed July 1, 2015). https://www.sec.gov/rules/proposed/2015/33‐9861.pdf
Digital Accountability and Transparency Act of 2014, Public Law 113‐101 (2014). https://www.congress.gov/113/plaws/ pubL201/PLAW‐113pubL201.pdf
Foundations for Evidence‐Based Policymaking Act of 2018, P.L. 115‐435 (2019). https://www.congress.gov/115/plaws/ publ435/PLAW‐115publ435.pdf
Maziarz, R. (2020, January 10). GREAT Act Becomes Law: What’s Next for Grant Recipients. Data Coalition. https://www.datacoalition.org/great‐act‐becomes‐law‐whats‐next‐for‐grant‐recipients/
Fatherree, K., & Hart, N. (2019). Funding the Evidence Act: Options for allocating resources to meet emerging data and evidence needs in the federal government. Data Foundation. https://www.datafoundation.org/funding‐the‐evidence‐act‐paper‐2019
Other federal agencies as well as state and local governments spend additional money on data gathering, reporting, and analysis. Ironically, without disclosure modernization we lack a complete and accurate accounting of the total spent each year, and so have to estimate disclosure modernization’s potential impact on this spending.
Lennox, J. (2019, Winter). Aristotle’s Biology. In The Stanford Encyclopedia of Philosophy, Zalta, E.N. (ed.). https://plato. stanford.edu/archives/win2019/entries/aristotle‐biology/
Cagle, K. (2019, August 23). The end of Agile. Forbes. https://www.forbes.com/sites/cognitiveworld/2019/08/23/the‐end‐ of‐agile/#5c2fb58d2071
Mayo, A. J., & Nohria, N (2005, October 2). The truck driver who reinvented shipping. Working Knowledge. https://hbswk.hbs.edu/item/the‐truck‐driver‐who‐reinvented‐shipping
Illustration of recognizing the character “8” from a number of noisy samples is adapted from Cruz, J.A., & Wishart, D.S. (2006). Applications of machine learning in cancer prediction and prognosis. Cancer Informatics, 2, p. 63. https://journals.sagepub.com/doi/pdf/10.1177/117693510600200030
James, W. (1892). Psychology. Henry Holt and Company, p. 295.
Guidelines is a term of art meaning interpretation of standards.
GovernmentFinanceOfficersAssociation.(2018).Certificate of achievement for excellence in financial reporting: General purpose checklist. https://www.gfoa.org/sites/default/files/GFOAGeneralPurposeChecklist.pdf
CAFR subject matter experts are encouraged to consider what is missing from the GFOA checklist and from the GASB codifications with regard to scope, precision, and completeness. These authorities, who maintain the domain knowledge for CAFRs, need to hear community requests for, and support of, CAFR disclosure modernization efforts.
Pope, K.R. (Director). (2015). All the queen’s horses [Film]. United Kingdom: Gravitas Ventures. This documentary tells the story of how the comptroller in the city of Dixon, Illinois embezzled $53 million over a two decade period.
Acknowledgments
The author wishes to thank Christina Scheuer for substantial drafting assistance; to Workiva for funding this paper; and to the following people who reviewed and commented on later drafts: Rafael Gonçalves, C. Christina Ho, Joseph Howell, Mike Starr, Richard Szabo, Catherine Tsai, and Carol Volpe.
Disclaimer
This paper is a product of the Data Foundation and Workiva. The findings and conclusions expressed by the author do not necessarily reflect the views or opinions of the Data Foundation, its funders and sponsors, or its board of directors.
© 2020 Data Foundation
Workiva is a registered trademark of Workiva Inc. All rights reserved. XBRL® is a trademark of XBRL International, Inc. All rights reserved. The XBRL® standards are open and freely licensed by way of the XBRL International License Agreement. Amazon, Alexa, and all related logos are trademarks of Amazon.com, Inc. or its affiliates. All rights reserved. Google and Google HomeTM are trademarks of Google LLC. All rights reserved. D‐U‐N‐S is a registered trademark of Dun & Bradstreet. All rights reserved. Westlaw® is a trademark of Thomson Reuters or its affiliates. All rights reserved. Bloomberg is a trademark of Bloomberg Finance L.P., a Delaware limited partnership, or its subsidiaries. All rights reserved. Morningstar® is a registered trademark of Morningstar, Inc. All rights reserved.